
Insights
J.S. Held Acquires Element Forensic Engineering, Expanding Insurance-Focused Capabilities for Mid-Market and Large Loss Property Claims Across Canada
Read MoreThe material in this paper was researched, compiled, and written by J.S. Held. It was originally published by SAE International.
White Paper By:
Richard Ruth, Ruth Consulting LLC
Charles King, J.S. Held
Andrew Rich, Rich Consulting LLC
Hamed Sadrnia, Timothy D. Brown & Associates
Event data recorders (EDRs) were harvested and imaged after Insurance Institute for Highway Safety (IIHS) 56 km/hr frontal and 64.4 km/hr frontal offset crashes of 15 different brands of 2016-2022 vehicles. The speed and delta-V in the EDR were compared to reference instrumentation. Speed data was accurate within the generally accepted range of +/-4%. The 40% overlap tests had generally similar vehicle kinematics, and their delta-Vx data was accurate. However, there was a much greater variance in the small (25%) overlap tests. Some outliers in the small overlap delta-Vx tests required further analysis using overhead video analysis. The video analysis more closely matched the EDR recorded values. These offset tests create significant post-crash rotation, and both EDR and IIHS instrumentation were affected by their location away from the center of gravity. The Y-axis was affected much more than the X-axis. The data scatter in Y-axis was significant, particularly in the IIHS reference instrumentation. Quantitative corrections were calculated and reduced the data set differences but did not bring every crash test into agreement.
EDR pre-crash speed and delta-V accuracy is important to the EDR analyst. Researchers have found creative ways to set EDR events to record speed data without crashing vehicles, but that does not test the delta-V. Full crash tests to evaluate delta-V typically require investment in or access to substantial test facilities, as well as purchasing costly new vehicles you are willing to destroy in testing. At one time, EDR researchers relied on access to NHTSA NCAP crash tests, but NHTSA stopped reading EDRs once 49CFR Part 563 took effect in Sept. 2012. The other main body testing a critical mass of vehicles is IIHS, but they are concerned mostly with occupant injury parameter measurement. Their test procedure does not call for reading EDR’s after their tests. Working with IIHS, the authors were able to contact the salvage yard IIHS sells its tested vehicles to and arrange to purchase a statistically significant sample of EDRs. Earlier reports on EDR delta-V have focused primarily on General Motors vehicles because they installed EDRs earlier and released the ability to read their data earlier than many other manufacturers. Now 99% of new vehicles sold in the US have an EDR that complies with the US Part 563 EDR regulation, which means it also has a publicly available tool to read the data [27]. This research will access data from 15 different brands of vehicles, more than have ever been presented in an EDR accuracy paper before.
Accuracy of EDR was first discussed in 1999 when GM and NHTSA co-authors published that GM speed data was +/-4% and delta-Vx was +/-10% [1]. They did not publish test data at that time, and it was believed to be a theoretical “stack-up” of component tolerances. Early 2000s testing of EDR speed vs reference 5th wheel measurements followed, and errors were within the previously declared +/-4% [3]. At the time, EDR speed was taken from a transmission output shaft sensor and adjusted by the powertrain control module for tire size and axle ratio (if needed); it was not necessarily the value displayed on the speedometer. Other publications evaluated delta-V [2, 4, 5].
In 2005, Niehoff published a comparison of delta-V data from NHTSA crash tests versus EDR [6]. Authors reported delta-V error as an RMS value, but it was consistent with the prior +/-10% absolute error. Data was mostly from GM vehicles because only GM and a few Fords were supported by the Bosch CDR tool at that time. The 2008 study by Gabler added to the sample size, including more 35 mph NCAP tests, and began to show error could exceed 10% if there was sensor clipping [7].
Papers on Ford and Chrysler speed data accuracy were published in 2008 and 2009 and were consistent with prior publications [8, 9].
There was a flurry of speed data testing on Toyota Gen 2 vehicles when Toyota released past model coverage to the Bosch CDR system in 2010, driven partly by the allegations of sudden acceleration in Toyotas creating a need to know the accuracy of Toyota EDRs [10,11,12,13]. Toyota Gen 2s truncated speed data to the next lower even number of km/hr, so it should be no surprise testing showed Toyotas tended to under report GPS speed.
Gabler et al. led a study comparing EDR data to NHTSA crash tests from 2010-2012 model year vehicles, just prior to the part 563 regulation taking effect [14]. A few more manufacturers had released the ability to read their EDRs.
Haight studied delta-V in 12 IIHS narrow overlap crash tests [15]. Delta-Vx matched IIHS instrumentation but delta-Vy did not, attributed to post crash rotation, EDR location in front of the center of gravity (CG), and IIHS instrumentation behind CG. Delta-Vy at CG from video analysis was consistently in between EDR and IIHS accelerometer values for all 12 samples. For the 2013 Civic, Delta- Vy from video taken at the EDR location was closer to EDR-reported values, as was Delta-Vy from video taken at IIHS accelerometer location closer to the IIHS measured value, proving that location of the measuring device mattered and must be considered in any analysis.
Honda EDR speed data was studied by Diacon and was the first vehicle studied to take EDR speed from the speedometer [16]. The speedometer filtered the raw wheel speed data leading to reported speed lagging during hard braking events, further delayed on digital speedometers.
Kia and Hyundai used a derivative of their dealer scan tool to read EDR data to satisfy Part 563, not using the more widely accepted Bosch CDR system. While Kia and Hyundai said there was no tool to accurately read and interpret vehicles built before Part 563 became effective, using the tool on 2010-2012 NHTSA NCAP crash test vehicles yielded 20 of 21 last speed data samples within 1 km/hr and 19 out of 20 Delta-Vx data samples within +/-10% [17].
In 2016 Bortles published a compendium of prior test results, for both speed and delta-V [18]. The conclusion on speed data was qualitative only, showing that EDR speed data tended to under report reference speed measurements. The data set was dominated by Gen 2 Toyotas which truncated speed to the next lower even 2km/hr. Delta-V was also listed as under-reported, attributed to clipping in some of the 56 km/hr barrier tests.
When the Part 563 regulation became effective September 1, 2012, (for all practical purposes for the 2013 model year), the regulation required delta-V accuracy of +/-10% [19]. The auto industry argued that this did not include effects of clipping. NHTSA amended the regulation to say, effective September 1, 2014, that if clipping occurred, the manufacturer must report that it did occur and when it first occurred in the crash sequence, recognizing that time series data after the clipping began may be understated.
49 CFR Part 563 requires the EDR “Speed, Vehicle Indicated” to be accurate to within +/- 1km/hr. This means within +/-1km/hr of what is displayed on the speedometer. No test procedure was ever created. EDR analysts know if the speedometer is right, so is the EDR, but if the speedometer is wrong, so is the EDR. The EDR is not required to be within +/- 1km/hr of GPS reference instrumentation. There is no regulation on US passenger car and light truck speedometer accuracy. FMVSS 101 simply says speedometers must display in miles per hour. US Commercial vehicles (buses, trucks and truck-tractors) are required by 49 CFR 393.82 to report within +/-8 km/hr at 80 km/hr. European vehicles are required to be within -0%/+10% plus 6 km/hr (+6.25 mph in the UK). SAE recommended practice J2976, February 2016, suggests speedometers should be within -1%/+4%. In addition, regulations apply only to new vehicles as they leave the showroom floor. They do not account for things such as tire wear over the life of the vehicle, installing a different tire size, or wheels spinning on a patch of ice. In other words, there is no US regulation on how accurate EDR speed data is compared to GPS or other accepted reference instrumentation. One European paper [24] tested VW Europe vehicles and reports a EDR/speedometer value 5% over the calculated wheel speed and reference instrumentation. So, there is value in testing EDR speed versus accepted reference speed measurements in the US in a post-563 environment.
This paper will evaluate accuracy of speed data and primarily delta- Vx in frontal offset IIHS crashes performed at 56 or 64.4 km/hr. Tsoi analyzed side impact cart crash tests in 2012 Kia vehicles [21] and noted that EDR delta-Vy often under-reported reference instrumentation. She offered a theory that the EDR locations in some vehicles caused underreporting as they were farther from the line of force which passed behind the center of gravity. A conceptual correction was offered by Rose [22] and a calculation for correction was published by Scurlock, Rich, and Poe in 2021 [20], using staged offset intersection collisions as an example.
When Part 563 took effect, NHTSA stopped requiring their crash test contractors to extract the ACMs for EDR analysis. A great source of data was lost. The primary other source of crash testing, IIHS, also did not read EDRs after the crash tests, since their reference instrumentation had already captured the data needed for injury analysis. Without a source of crash test data, most new model year EDR accuracy evaluation came to a halt. Regional, national, and WREX crash conferences conduct some instrumented crash testing, but often use older models donated by insurance companies for cost reasons.
IIHS sells their test vehicles after crashes to M&M Salvage for dismantling and sale of undamaged parts to offset costs. 46 ACMs were purchased from M&M from vehicles in moving frontal tests over the last 2 years, based on test lists provided by IIHS. The EDRs were read using the appropriate tool, either the Bosch Crash Data Retrieval system, Kia/Hyundai EDR reader, or Tesla EDR reader. The resulting data set represents 15 different brands including Ford, Chrysler, VW, Toyota, Tesla, Chevrolet, Nissan, Jeep, Hyundai, Mitsubishi, Honda, Subaru, Mazda, Kia, and Buick.
IIHS issued reports and uploaded data to their public “techdata” website from 40 of these tests. Data included speed at impact, acceleration data every .0001 second for X- and Y-axis, accelerometer and CG location relative to the front axle, videos and still photos. Accelerometer data was obtained directly from IIHS for an additional 3 tests. The 3 full frontal barrier tests run at 56 km/hr were conducted for a private client and no report or accelerometer data was made public, so they were only included in the speed analysis comparing EDR to the target test speed. For the remaining tests, Speed, delta-Vx, and delta-Vy data was analyzed vs the EDR. Data elements such as brake on/off, accelerator pedal position, engine rpm, steering, and stability control system data such as yaw rate are not exercised in these crash tests and hence are beyond the scope of this paper. The degree of clipping in these relatively severe tests was assessed.
The plan was to compare the EDR Delta V from IIHS test instrumentation accelerometer. There was a significant difference in the vehicle kinematics between the 40% overlap tests and the 25% overlap tests, and a greater variation in kinematics in the 25% overlap tests. These two different test types were divided into separate groups for analysis purposes. The 40% overlap test group delta-Vx was relatively consistent. The 25% overlap group contained 4 crash tests in which there was significant error between the delta-Vx recorded by the EDR and that recorded by the IIHS data acquisition system (DAS). An alternative method was required to determine whether the source of error was the EDR or the IIHS DAS in each case.
IIHS record their crash tests using an array of high-resolution, highspeed cameras mounted in the vehicle and at strategic positions in the crash hall. All the high-speed cameras capture at a rate of 500 frames per second. Figure 2 shows the locations of the six exterior cameras within the crash hall. This video data is publicly available and can be analyzed using video motion-tracking software. Kinovea is a free and open-source video analysis software primarily designed for the evaluation of sports and athletic performance and features sub-pixel targeting, automated tracking, and lens distortion compensation. While Kinovea is not specifically intended for tracking and analyzing vehicle motion, prior research by Paolino [23] has shown it can be used reliably and accurately for this purpose.
High-speed footage from the overhead camera at Position A was obtained and analyzed for 17 tests, including the 4 symptomatic tests and 13 tests which showed minimal error in the previous evaluation. All videos were analyzed in the same manner as previously described by S. Haight and W.R. Haight [15]. Each video was loaded in Kinovea and, to provide a basis for scale measurements, calibrated using the 75 cm fiducial marker placed by IIHS on the vehicle roof. At minimum, the positions of the CG and accelerometer markers on the vehicle were tracked for every sample from the first available frame until after separation from the barrier. In some instances, additional points were tracked along the sides of the vehicle to allow additional kinematics analysis. The resulting coordinate set was exported to a spreadsheet and analyzed.
The velocities of both the CG and the accelerometer markers were calculated in Excel as the time rate of change of position in the X and Y- axes. Positions and velocities derived from the video are expressed in terms of the image coordinate system. At impact, the vehicle centerline is approximately parallel to the image’s X-axis. However, due to the offset impact configuration, the vehicle rotates prior to separation from the barrier. To make a valid comparison to the EDR data, the angle of the vehicle was also calculated at each time step. The vehicle angle was used to project the velocity vector onto the vehicle’s X- and Y-axes. The formulae used for this projection are given in Figure 3.
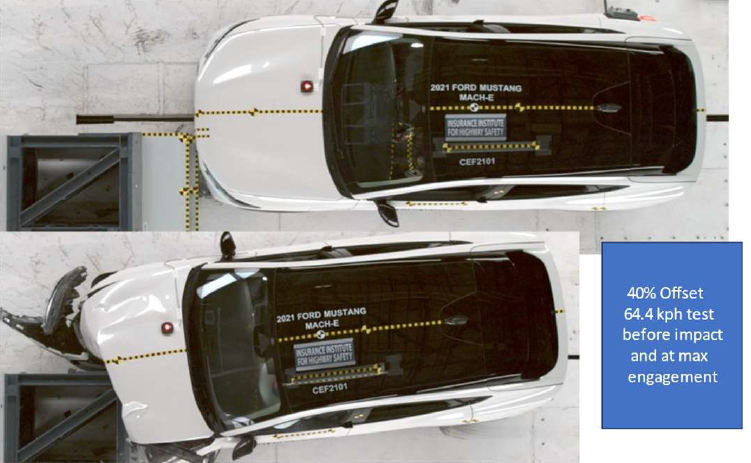
Figure 1 - IIHS 40% overlap test first engagement vs max engagement.
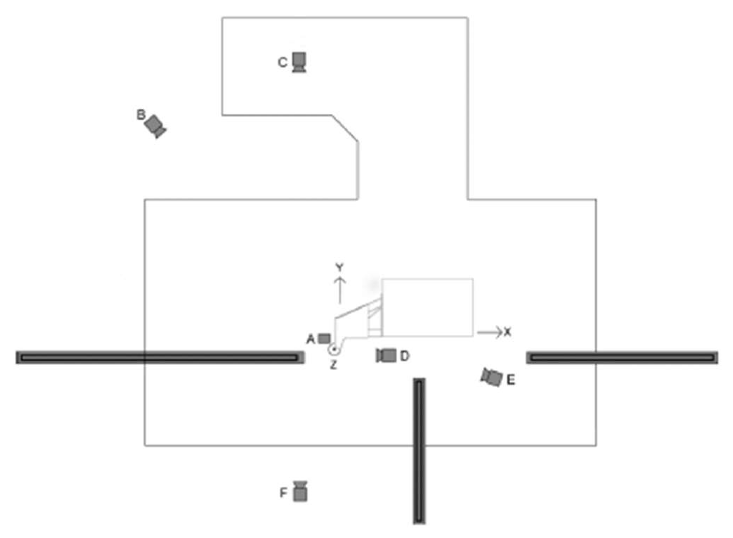
Figure 2 - IIHS overhead camera positions from IIHS small 25% Overlap test procedure p. 12.
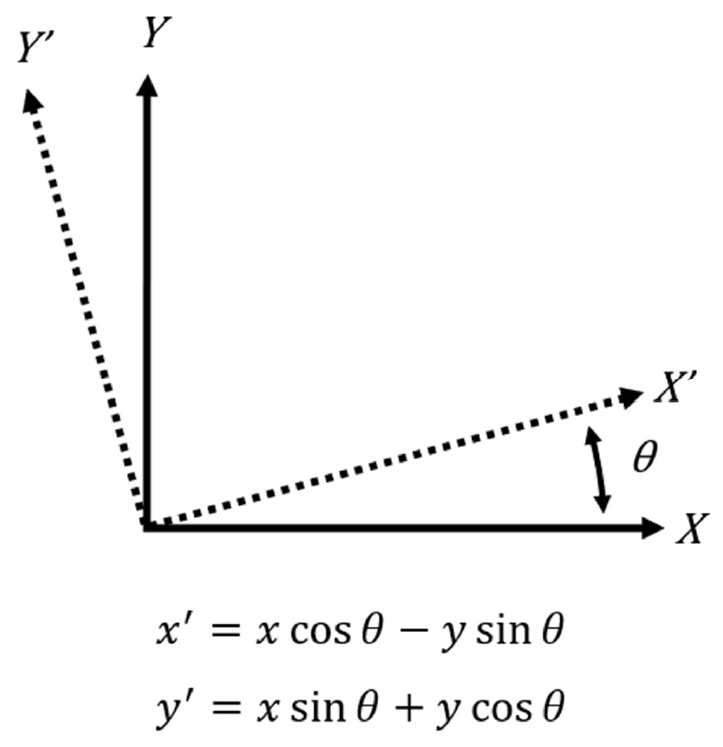
Figure 3 - Formulae for velocity vector projection from SAE J211.
IIHS reports give the actual speed at impact with a resolution of 0.1 km/hr. In the 39 reports reviewed, tests conducted with a 64.4 km/hr target speed had actual speeds ranging from 64.0 to 64.5 km/hr. Three tests conducted at 56 km/hr and four at 64.4 km/hr did not have reports issued. For these tests, the target test speed was used in lieu of a reported impact speed. All 7 EDRs without reports had a last EDR speed within 0.6 km/hr of the target speed. For the tests run at a target speed of 64.4 km/hr, the EDR reported speeds between 62 and 66 km/hr. For the 3 tests run at a target speed of 56 km/hr, all 3 EDRs reported a last speed of exactly 56 km/hr. The 56 km/hr tests were excluded from the statistics so as not to affect the average and standard deviation of the mostly 64.4 km/hr tests.
On average the EDR reported speed slightly lower than the IIHS instrumentation, by -0.18 km/hr, with a range from -2.2 to + 1.9 km/hr. This equates to -3.4% to +3.0% at urban speeds, well within the generally accepted +/-4%. Some of this error is due to the EDR reporting speed in integer values with a resolution of 1.0 km/hr. Error induced by resolution would have a higher percentage effect at lower speeds and a lower percentage effect at higher speeds. While this is a small sample, for each manufacturer it is interesting to note that the only two tests where the EDR over reported by 1.9 km/hr were both Tesla vehicles. The manufacturer with the lowest reported last speeds was Toyota. The sample size is not sufficient to reach conclusions about relative reporting of different manufacturers, but it is interesting to note. In all 4 Toyotas the EDR reported lower values than the IIHS instrumentation.
Table 1 - IIHS Speed - EDR Speed Difference in km/hr.
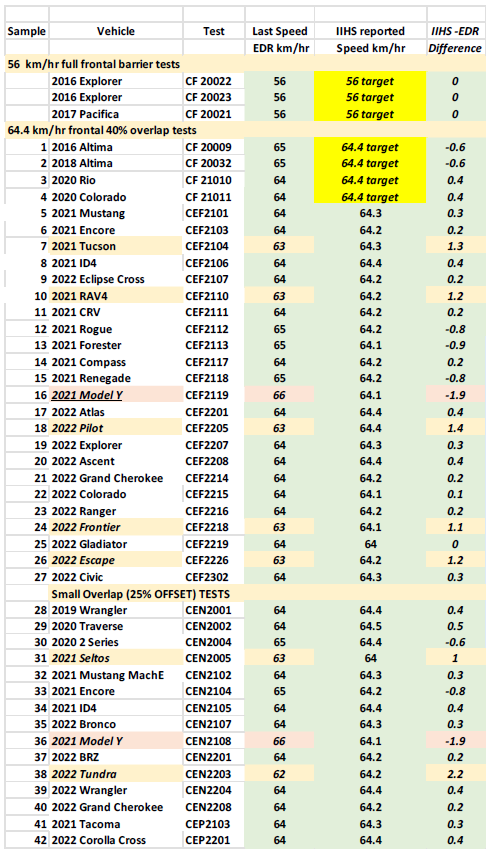
The authors compared EDR and IIHS reported last speed before impact for 42 tests. One test was excluded due to EDR mounting pad distortion during the test. The analysis looked at the difference between the individual data points (EDR – IIHS). The average difference was -0.2 km/hr with a range of -2.2 to +1.9 km/hr. The last recorded EDR speed data provided a mean of 64 km/hr with a standard deviation of 0.78. The IIHS reported speed data provided a mean of 64.3 km/hr with a standard deviation of 0.125. The closeness of the means and the small standard deviations indicate a good correlation between the EDR and the reference instrumentation. The Coefficient of Variation (COV) can be used to compare the spread of the data relative to its own meaning. It is a relative variation that can be used to compare the degrees of variability among different data sets. For the last recorded EDR speed data the COV was 1.20% while for IIHS data was about 0.2%. This indicates more consistency of IIHS reported speed, as expected, it is reported to a resolution of 0.1 km/hr vs. the EDR which typically has a resolution of 1.0 km/hr. Table 2 and Table 3 are the summary of the descriptive statistics of these two data groups.
Table 2 - IIHS Speed – Descriptive Statistics - EDR Speed Difference.
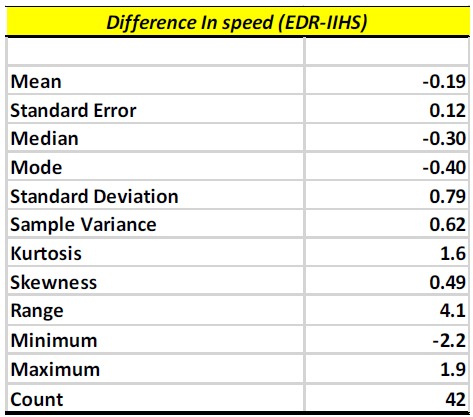
Table 3 - Descriptive Statistics for IIHS Speed & EDR Speed Samples.
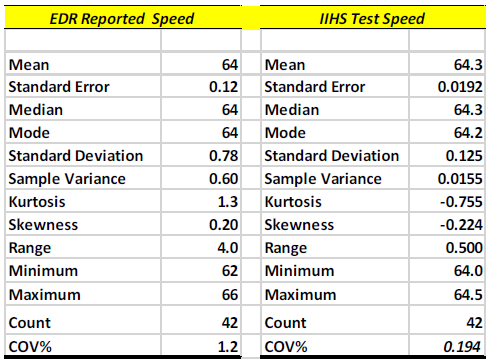
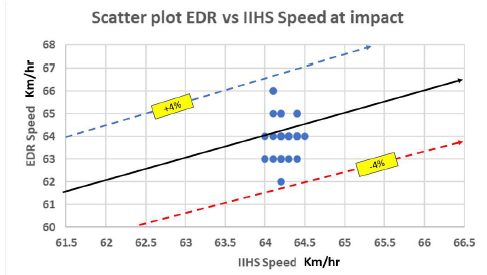
Figure 4 - IIHS speed vs EDR speed scatter plot.
The original 1999 Chidester paper gave GM’s theoretical stack-up speed error as +/-4%. The data in these 42 tests at 64 km/hr suggests that the EDR is as good or better than that today across the 15 brands tested. Data resolution and truncation to the next lower whole km/hr at 64 km/hr may be responsible for up to -1.5%/+0% of the difference. The error as a percentage would be expected to be less at higher speed, and more at lower speed. For example, when 4.99 km/hr is truncated to 4, it is reporting 20% low.
The EDR-reported maximum delta-Vx and the time it was reached were recorded for each impact test. Maximum was taken at the first local maximum or when the reported delta-V did not change more than 0.8 km/hr over 20 ms, the NHTSA definition of the end of a crash (from EDR regulation section 563.5 definitions, end of event time). IIHS delta-Vx was calculated from the X-accelerometer. The maximum was chosen as the end of the first local maximum or when the magnitude increased by less than 0.8 km/hr over 20 ms.
For Delta-Vx, the sample will be broken into two groups. Of the 27 tests run at 64.4 km/hr with 40% overlap, IIHS delta-V data was not available for CF21011, leaving 26 tests where IIHS accelerometer data was available to compare to the EDR recorded speed change. In the first data group (n=26) the 40% overlap test consistently stopped the vehicle’s forward progress followed by some rebound, adding to the delta-Vx. The tests were all impacts on the driver side and the vehicle consistently rotated counterclockwise, reaching from 45 to 90 degrees by the end of the video. EDR delta-Vs ranged from 68 to 73 km/hr. The 3 tests run at 56 km/hr did not have reference data available but had delta-Vs consistent with the expected restitution in a full-frontal barrier test.
The second data group consists of (n=15) 64.4 km/hr small overlap tests. Delta-Vs in the 25% overlap tests varied widely from 31 to 60 km/hr, and vehicle kinematics varied from simply glancing off the barrier to the vehicle nearly stopping as the barrier hit the A-pillar and rotated off it. Two Jeep vehicles rolled 90 degrees onto their side following the impact. The data scatter is much wider in this group.
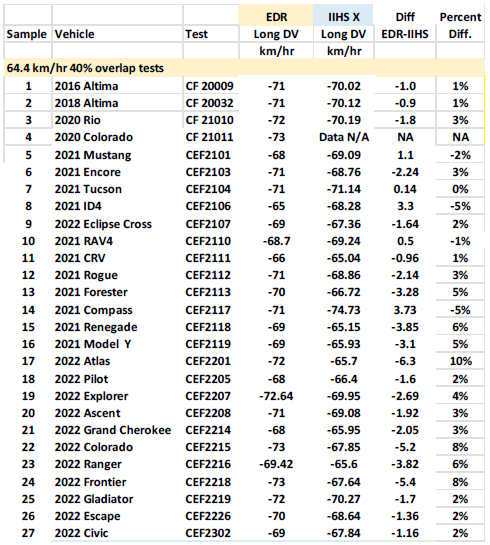
The 26 tests with data available in the 40% overlap group were within the previously published +/-10% delta-V accuracy. For the Atlas, the higher resolution IIHS delta-V data showed the crash to be over before 150ms, so 72 km/hr should be used as the EDR value, not the 73 km/hr reported after 150ms.
Table 4 - IIHS Delta-Vx - EDR Delta-Vx Data – 40% Overlap Tests.
To compare similar tests with similar vehicle kinematics, the test group was divided into 40% overlap frontal and 25% overlap frontal crashes.
EDR data was available for 27 40% offset tests, but IIHS data was not available for one of those, leaving 26 with both IIHS and EDR data. The difference between delta-Vx values for 26 crashes with 40% frontal overlap orientation was analyzed. Similar to speed comparison, the difference was defined as EDR-IIHS recorded values. Different vehicle designs may have different restitution, but by subtracting the two values from the same test the difference observed is in the measurement devices and not in the vehicle restitution. The IIHS barrier instrumentation is presumed to be accurate. Any difference is presumed to be an error in the EDR. A prime objective of this research is to see how that error compares to the commonly accepted +/-10% error not including clipping. The average difference was calculated to be -1.7 km/hr with a range of -6.30 to +3.7 km/hr on an average base of -68.29 km/hr. Table 5 summarizes the overall statistics for the differences.
The EDR delta-Vx had an average of -70 km/hr with a standard deviation of 2.1 and COV of -3% while IIHS delta-Vx had an average of -68.29 km/hr with a standard deviation of 2.211 and somewhat larger COV of -3.237%. For these two data sets, the descriptive statistics are summarized in Table 6.
Table 5 - IIHS Delta-Vx - EDR Delta-Vx Data – 40% Overlap km/hr.
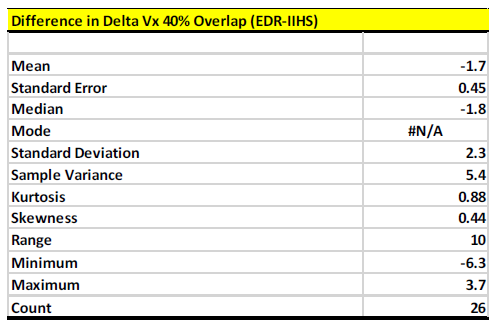
Table 6 - EDR & IIHS Delta-Vx Data – 40% overlap km/hr.
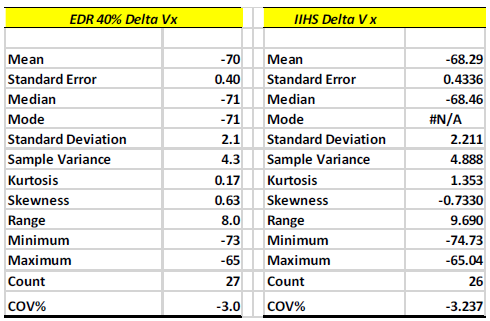
It is interesting to note that the average recorded EDR delta-Vx overestimated the average recorded IIHS delta-Vx by about 1.7 km/hr. The boxplot in Figure 6 shows that the IIHS distribution has a greater median and wider distribution. It also shows the comparison between these two datasets and as it shown, the EDR delta-Vx is generally overestimating the IIHS delta-Vx. Prior research (Niehoff 2005 [6], Gabler 2008 [7]) observed the EDR under-reported reference instrumentation, possibly due to clipping and possibly contributed to by the EDR truncating fractional values to the next lower whole number. Those publications were heavily weighted to General Motors products and the test type was NCAP 56 km/hr mph full frontal barrier versus this research on IIHS 40% overlap tests and much newer models than prior studies referenced.
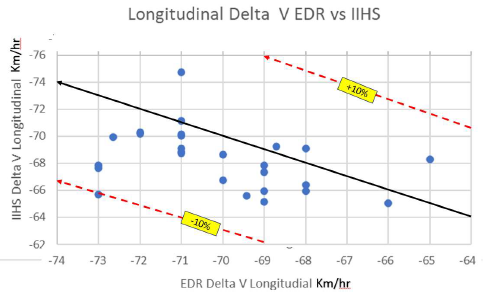
Figure 5 - IIHS 40% Overlap Delta-Vx vs EDR scatter plot.
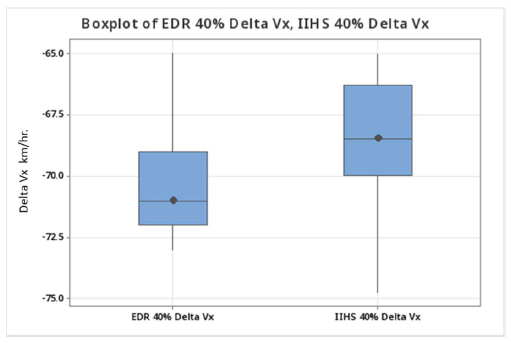
Figure 6 - Boxplot 40% overlap IIHS Delta-Vx vs EDR Delta-Vx.
What is also interesting is the shape of these two distributions. Figure 7 shows these two histograms where the EDR delta-V has a positive skewness of 0.51 while IIHS delta-V has a negative skewness of -0.66. Analysis of skewness indicated a very small coefficient of skewness.
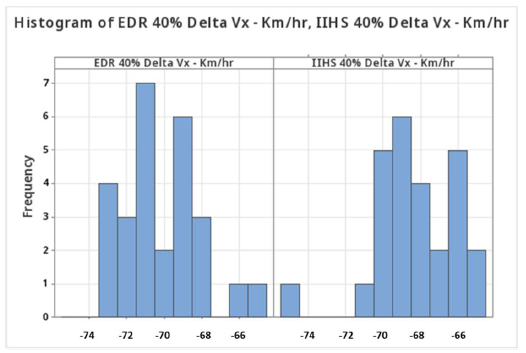
Figure 7 - Histogram IIHS Delta-Vx in 40% overlap tests vs EDR Delta-Vx.
The sample is not large enough to reach a conclusion, but on the surface does not appear to be a normal distribution.
Previous data from 56 km/hr full frontal barrier testing was suspected of under reporting delta-Vx due to clipping, but there was insufficient data to determine it conclusively. Part 563 began to require manufacturers to identify when a sensor exceeded its design range after Sept. 1, 2014. 17 of the 27 40% overlap tests had a data element printed in the EDR report indicating no longitudinal clipping occurred. The other 10 did not print anything, which could mean that no clipping occurred, so it was not necessary to report it. Those 10 were reviewed in detail and determined to have no clipping either. For those EDRs that reported acceleration, peak values were all less than 49G and most were in the 30’s.
The second group of small overlap tests showed a much wider data scatter.
The authors compared the difference between delta-Vx values with 25% frontal overlap orientation. The difference was defined as EDRIIHS recorded values. The average difference was calculated to be -4.7 km/hr with a range of -35 to +5.2 km/hr.
While the majority of tests were within the accepted +/-10% guideline for reference instrumentation to the EDR, there were 4 exceptions that required further examination. Video analysis of movement of the center of gravity marker, and of the instrumentation location marker were used to compute delta-Vx for these cases, they will be addressed in order of the magnitude of the initially reported error.
Table 7 - Small Overlap Delta-Vx data EDR vs IIHS.
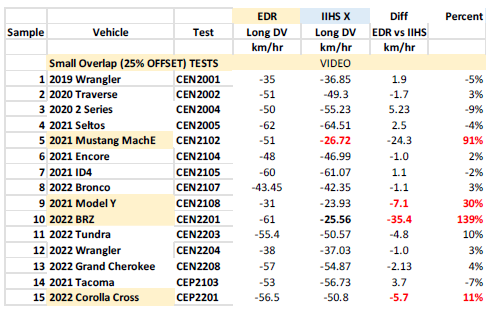
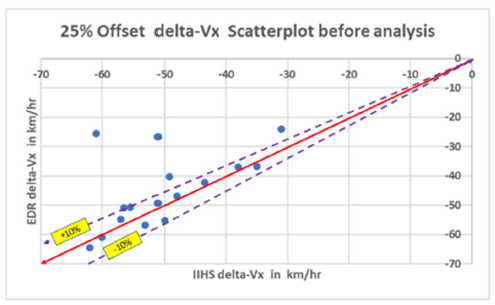
Figure 8 - Small Overlap Delta-Vx data EDR vs IIHS Scatterplot.
2022 BRZ CEN2201
The EDR registered a -61 km/hr delta-Vx compared to the IIHS accelerometer data at -25.56 km/hr. Observing the vehicle kinematics on video indicated the BRZ A-pillar engaged the offset barrier and nearly stopped the vehicle, indicating the delta-Vx magnitude should be just below the 64.2 km/hr impact speed. Data was reviewed with IIHS. While the summary report was silent, Diadem root data table cell G12 notes that the accelerometer block was installed at a 90 degree angle. While the X and Y were fixed, the X value is still substantially below the expected value. IIHS advised if there was a discrepancy to rely on other physical evidence (meaning video analysis). The video analysis at the center of gravity resulted in a delta-Vx of -61.6 km/hr, and video at the IIHS accelerometer location was -61.5 km/hr, both very close to the EDR reported value of -61 km/hr. The video values were substituted for the accelerometer values in the upcoming corrected Delta-V Figure 9.
2021 Mustang Mach E CEN2102
The EDR registered a -51 km/hr delta-Vx compared to the indeterminate IIHS accelerometer data at -26.72 km/hr at the same time as the end of the crash in the EDR at 140ms. Observing the vehicle kinematics on video indicated the Mustang A-pillar engaged the offset barrier and slowed substantially followed by translating away from the barrier while rotating slowly, indicating the delta-Vx magnitude should be 10-15 km/hr below the 64.3 km/hr impact speed. The IIHS accelerometer continued to read 15+ G after the vehicle separated from the barrier, eventually accumulating more delta-V than the impact speed. The data was reviewed with IIHS and while the summary report was silent, in the diadem root table cell G12 there was a note that the accelerometer broke loose from its mounting during the test. The video analysis at the center of gravity resulted in a delta-Vx of -52 km/hr, and video at the IIHS accelerometer location was -52.7 km/hr, both very close to the EDR reported value of -51 km/hr. The reference value was updated to the video value in the upcoming figure 9.
2021 Model Y CEN2108
The EDR registered a -31 km/hr delta-Vx compared to the IIHS accelerometer data at -23.93 km/hr, a 30% difference. Observing the vehicle kinematics on video indicated the barrier first engaged the bumper and front suspension, with the vehicle deflecting away from the barrier such that the A-pillar was not engaged, and the crash was more of a sideswipe with little rotation post impact, indicating the delta-Vx magnitude should be significantly less than the 64.1 km/hr impact speed. This was reviewed with IIHS. The summary report is silent and there are no notes in Diadem root cell G12. IIHS advised if there was a discrepancy to use the physical evidence from the video. The video analysis at the center of gravity resulted in a delta-V of -33.1 km/hr, and video at the IIHS accelerometer location was -39.6 km/hr.
2022 Corolla Cross CEP2201
The EDR registered a -56.5 km/hr delta-Vx compared to the IIHS accelerometer data at -50.80 km/hr, an 11% difference. Observing the vehicle kinematics on video indicated the Corolla A-pillar engaged the offset barrier, significantly slowing the vehicle and inducing heavy rotation, indicating the delta-Vx magnitude should be just below the 64.4 km/hr impact speed. This was reviewed with IIHS, the summary report was silent and there were no Diadem root cell G12 notes. IIHS advised to rely on physical evidence (video). The video analysis at the center of gravity resulted in a delta-Vx of -57.1 km/hr, and at the IIHS accelerometer location was -56.2 km/hr, both very close to the EDR reported value of -56.5 km/hr. The EDR to IIHS accelerometer difference was only 11%, just over the accepted +/- 10%, but the video analysis suggests the EDR was more correct than the IIHS accelerometer. Normally the laboratory grade accelerometers would be expected to be more accurate.
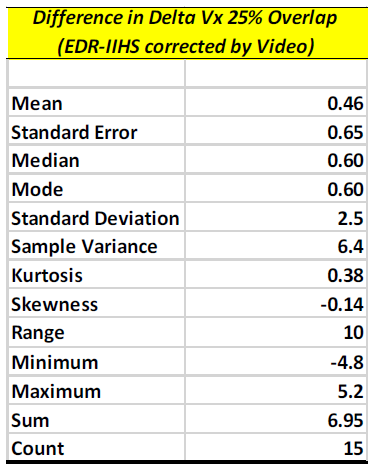
After replacing the 4 questionable IIHS delta-Vx values with the values obtained from video analysis, the scatterplot improves as shown below in Figure 9 with 15 samples. Table 8 and 9 summarize the descriptive statistics after the corrections were made using video analysis.
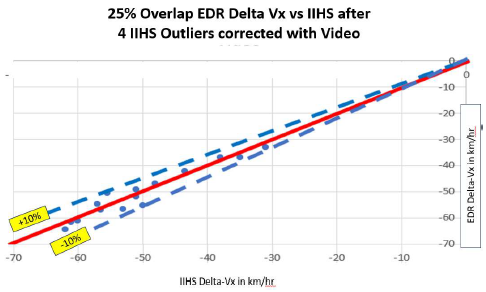
Figure 9 - Small Overlap Delta-Vx data after video corrections to IIHS.
Table 8 - Differences Delta-Vx data EDR vs IIHS corrected by video.
Remaining Tests
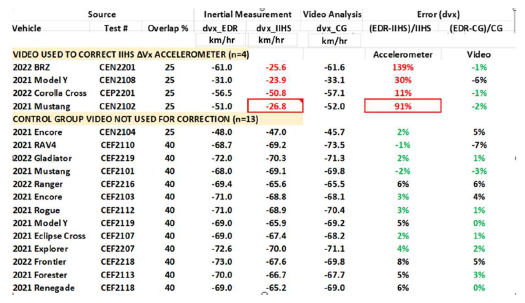
Each test’s individual graph of EDR vs IIHS delta-Vx is included in the appendix. Since some of the IIHS longitudinal accelerometers appeared not to be accurate, the authors could not automatically assume all the other IIHS data was accurate. There were insufficient resources to check every test, but a “control group” of 13 tests where the EDR and IIHS data agreed were cross checked using video analysis. Results are shown in Table 10. This sample was deemed sufficient to have confidence in the remaining IIHS longitudinal acceleration measurements.
Table 9 - Delta-Vx for 25% overlap for EDR and IIHS with outliers.
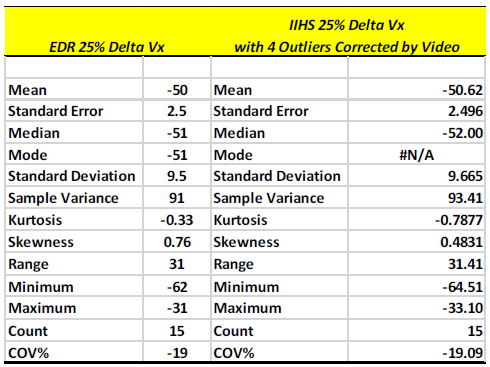
Table 10 - All Video Analysis of Delta-Vx – Outliers and Control Group.
The 40% overlap tests were grouped because they all had similar vehicle kinematics. Both the Tsoi paper [21] on SINCAP and the Haight paper on IIHS Offset crash tests [15] noted differences in delta-Vy EDR recorded values vs reference instrumentation. At the time this was attributed to the significant rotation induced during the offset collisions and the EDR and reference instruments not being on the center of gravity, but no quantitative correction for sensor location to the CG was done. The raw data showed a significant variance between the EDR and the IIHS instrumentation. This current research shows similar significant variation. The average EDR delta-Vy is less than half of the average IIHS delta-Vy, and the data scatter is significant.
In addition, the authors were concerned that either the EDR or the instrumentation may be near the R0 line. Scurlock et al [20] write that there is an imaginary line known as the R0 line along which a unique solution for the corrected delta-Vy at the CG cannot be found. The R0 line can be written as a function of the position of the EDR/accelerometer longitudinal displacement from the CG. The R0 line is dependent upon the damage centroid location and the yaw radius of gyration. The R0 point resides on the R0 line and “can be thought of as the post-impact instantaneous center of rotation [in the Earth frame] for all points within the vehicle.” The Scurlock research demonstrates that delta-V adjustments made to EDRs/accelerometers that are located close to the R0 line will have large error bars. By tracking the displacements of three or more points at differing lateral positions on the vehicle body, the authors were able to identify the instantaneous center of rotation and the R0 line. Figure 10 shows one such analysis, confirming that the accelerometers and the EDR were not near the R0 line.
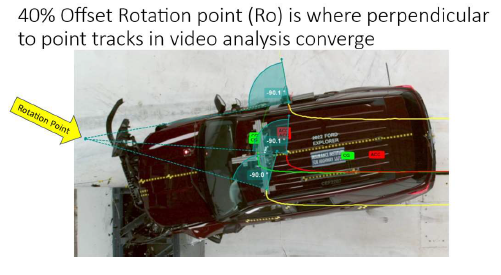
Figure 10 - Video tracking of points during crash.
Table 11 - Data for 40% Overlap Delta-Vy before any correction.
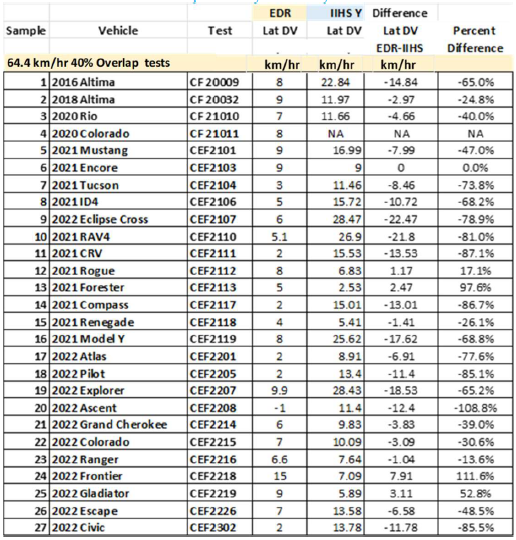
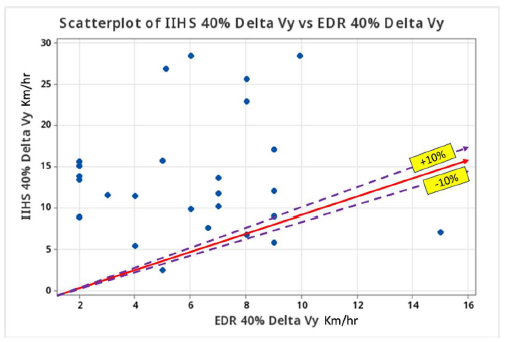
Figure 11 - Scatterplot of 40% overlap tests Delta-Vy.
The authors had EDR data from 27 tests, but one did not have IIHS data, leaving 26 to compare the difference between EDR delta-Vy values and IIHS with 40% frontal overlap orientation. Similar to speed comparison, the difference was defined as EDR-IIHS recorded values. At this stage, there has been no adjustment performed to account for EDR, centroid of damage, and IIHS accelerometer locations relative to vehicle COM. The average difference was calculated to be -7.5 km/hr with a range of -22 to +7.9 km/hr. Table 12 summarizes the descriptive statistics for the difference between these two groups.
Table 12 - Statistics for Delta-Vy 40% overlap tests.
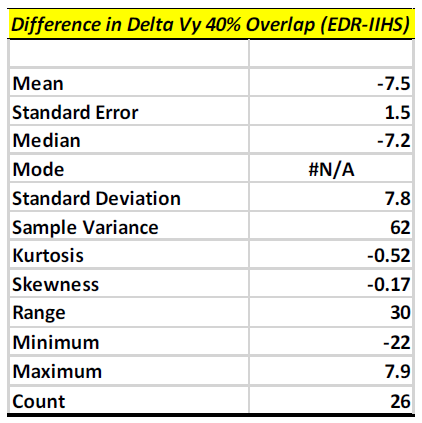
The EDR recorded delta-Vy had an average of 6.2 km/hr. with a standard deviation of 3.1 and a very large COV of 50%. The IIHS recorded delta-Vy had an average of 13.69 km/hr with a standard deviation of 7.287 and slightly greater COV of 53.23%. The average recorded EDR delta-Vy underestimates the average recorded IIHS delta-Vy by 7.5 km/hr. For these two data sets, the descriptive statistics are summarized in Table 13.
Table 13 - Descriptive Statistics for Delta-Vy.
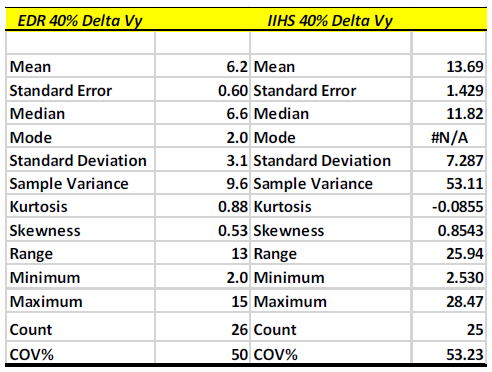
Figure 12 shows that the IIHS distribution has a higher median value, wider distribution, with one recorded outlier at 28.47 km/hr (CEF2107) while EDR data shows an outlier at lower value (CEF2218).
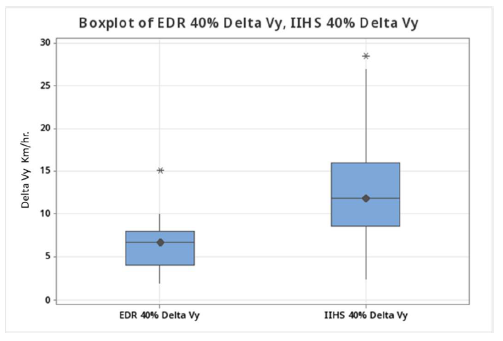
Figure 12 - Boxplot of 40% Offset Delta-Vy.
Approximately half of the EDR’s were positioned on the center of gravity. The poor correlation was attributed to the locations of some EDR sensors being forward of the CG and all IIHS sensors being rearward of the CG, affecting the Y Delta-V during rotation.
The quantitative adjustment published by Scurlock, Rich and Poe in 2021 is shown below in Figure 13. [20].
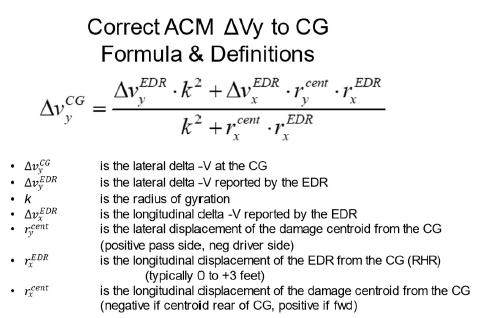
Figure 13 - Formula to correct delta-Vy to CG [20].
First, the EDR values were corrected to the CG resulting in the data shown in Table 14. Weight for vehicles as tested with instrumentation was obtained from the IIHS report for 23 of the 27 tests. No report was available for the 4 tests with the “CF” prefix. Sample size will be n=23 for this portion of the analysis.
Table 14 - EDR uncorrected to EDR corrected location in 40% overlap tests.
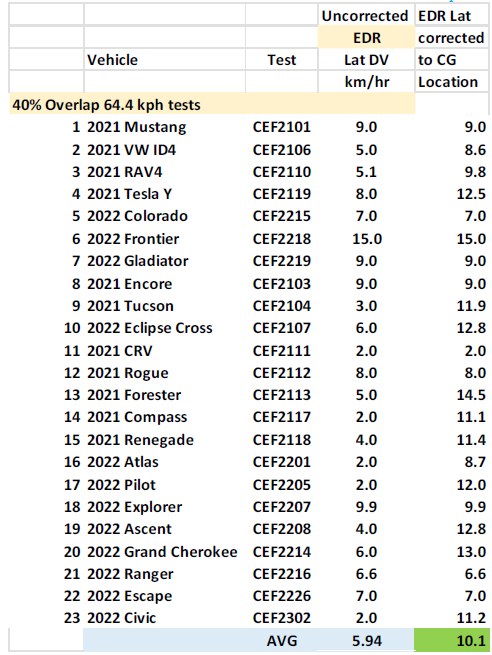
The resulting scatter plot is shown in Figure 14. The vehicles with EDR on the CG did not change and are located on the red unity line. The adjustment formula increased the magnitude of all the other delta-Vy values since the CG was rearward and on a larger moment arm than the ACM.
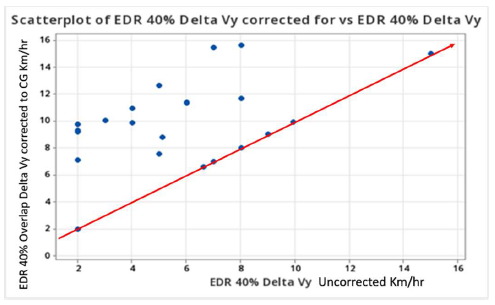
Figure 14 - Scatterplot showing correction for location of EDR Delta Vy to GG in 40% overlap tests.
To make these adjustments requires quantifying the damage centroid and the EDR location relative to the CG. The authors used still frames of the overhead videos before the crash and at max engagement to estimate the centroid of damage. The deformable barrier went under the hood and the hood obscured the view of the damage under it, making it difficult to determine the centroid precisely. The authors estimate the accuracy to be +/-3 inches.
The authors did not have access to the vehicles to record the precise EDR location. They had to rely upon the Bosch CDR help file and personal experience to estimate the EDR location. The CDR help file discriminates between center tunnel under dash and center tunnel between seats (approximately on the center of gravity). For those under dash, overhead video still frames were used to measure to the forward brim of the instrument panel as an approximation of the EDR location.
Initially the Garrott [25] method of calculating Iy was used. Later a sample of 8 were recalculated using the MacInnis [26] method and the Iy was found to be within +/- 11 % of the Garrott method. The calculations presented are using the Garrott method.
Those EDRs located forward of the center of gravity were adjusted using the Scurlock-Rich-Poe equations. As expected, the EDR delta-Vy translated to the center of gravity increased and got closer to the IIHS values.
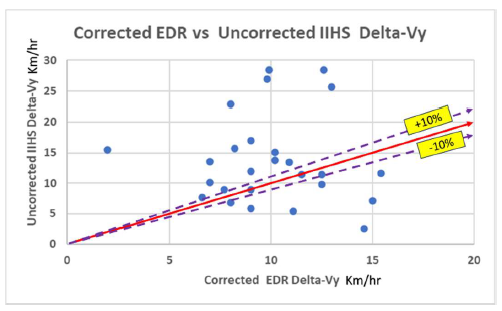
Figure 15 - Corrected EDR vs Uncorrected IIHS Delta-Vy.
The correction formulas were applied to the IIHS delta-Vy data. These corrections from the IIHS accelerometer locations to the CG generally reduced the Delta-Vy as expected, but the correlation did not significantly improve.
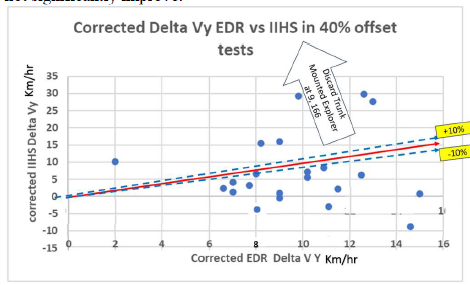
Figure 16 - Corrected EDR vs Corrected IIHS Delta-Vy 40% overlap.
Due to the wide variation in vehicle response to the test inputs, this group was separated from the main group of 40% overlap tests where the vehicle kinematic response was more consistent. The sign of the delta-Vy in passenger side crashes was reversed to allow data to be graphed and included in statistics in the same group as driver side crashes.
The most distinct outlier was the Ford Explorer CEF2207 in which the primary instrumentation on the backseat floorboard failed. In this instance, additional data was included from accelerometers mounted in the trunk. The additional distance from the CG caused even greater overreporting of the delta-Vy. It was outside the 2-sigma range and is excluded going forward.
Delta-Vy values for 15 crashes with 25% frontal overlap were compared. Similar to speed comparison, the difference was defined as EDR-IIHS recorded values. At this stage, there has been no adjustment performed to account for EDR, centroid of damage, and IIHS accelerometer locations relative to vehicle COM. The average difference was calculated to be -9.6 km/hr with a range of -30 to +11 km/hr. Table 15 summarizes the descriptive statistics for the difference between these two groups.
Table 15 - Descriptive Statistics for Difference in Delta-Vy (n=15).
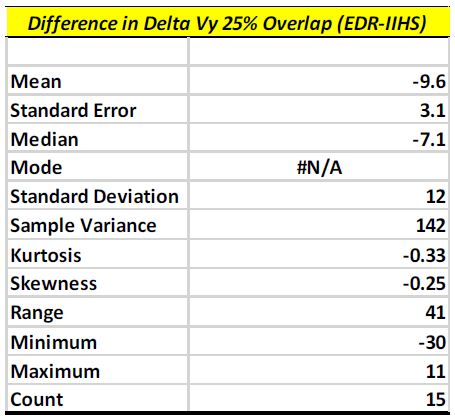
The EDR recorded delta-Vy had an average of 13 km/hr with a standard deviation of 6.4 km/hr and a very large COV of 48%. The IIHS delta-Vy had an average of 22.79 km/hr with a standard deviation of 7.823 km/hr and a smaller COV of 34.33%. The average recorded EDR delta-Vy underestimates the average recorded IIHS delta-Vy by 9.6 km/hr. For these two data sets, the descriptive statistics are summarized in Table 16.
Table 16 - Descriptive Statistics for Small Overlap Delta-Vy (n=15).
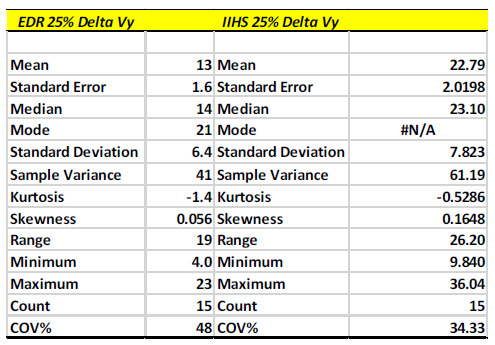
Figure 17 shows the distribution of this set of data. The IIHS data has a wider spread as compared to the EDR recorded data. The EDR data tends to be more symmetrical than the IIHS data.
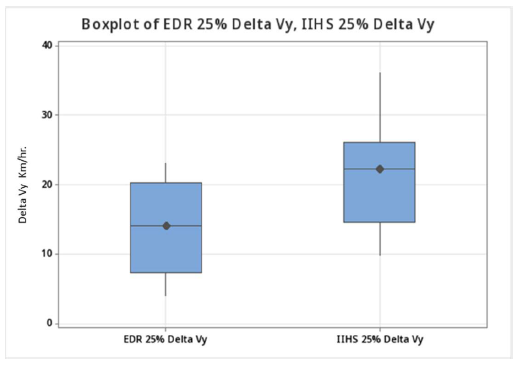
Figure 17 - Boxplot of Small Overlap (25%) Delta-Vy.
Figure 18 is the scatter plot visually showing what the statistics described, it indicates that the EDR delta-Vy is significantly lower than the IIHS delta-Vy (n=15).
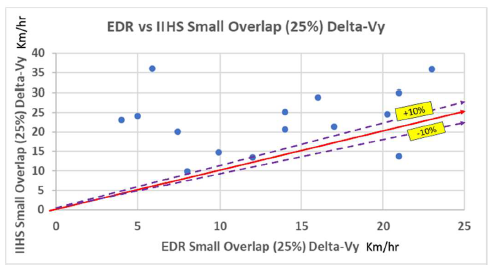
Figure 18 - 25% Overlap test delta-Vy EDR vs IIHS scatter plot.
The data was split to isolate vehicles where the EDR was on the CG, to eliminate the EDR location correction as a variable. After further review, the Mustang CEN 2102 IIHS delta-Vy curve shape (see appendix) became erratic, and the sample was eliminated for any correction calculations. This leaves n=7 for EDR on CG.
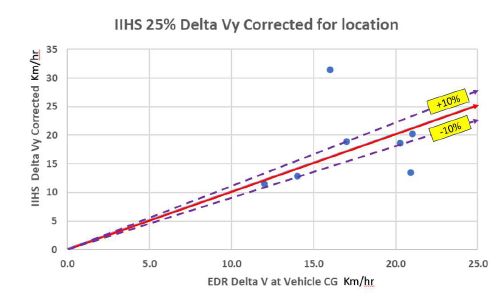
Figure 19 - IIHS Delta-Vy corrected to CG, EDR on CG.
Five of the seven data points were within the generally accepted +/- 10% range but two were well outside those limits. The n=7 where the EDR Delta-Vy had to be adjusted to CG are below.
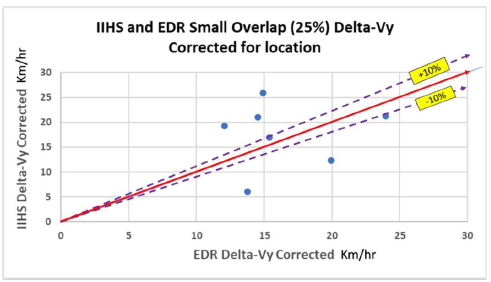
Figure 20 - IIHS Delta-Vy Corrected to CG, EDR corrected to CG.
As expected, adding the correction to the EDR location in addition to the IIHS instrument location increased the scatter.
Since the video analysis was useful in explaining the discrepancies in Delta-Vx in the small overlap tests, it was employed to be a second set of reference instrumentation for Delta-Vy. The video was used to track the CG directly so there was no translation error from the accelerometer location to add to any measurement error. Table 17 shows the data for 17 of the tests. These are the same 17 tests where video was analyzed in the X direction. Values shown are EDR corrected to CG vs Video analysis. This was a mixed group of both 40% overlap and small overlap.
Table 17 - EDR Delta-Vy corrected to CG vs Video Delta-Vy in km/hr.
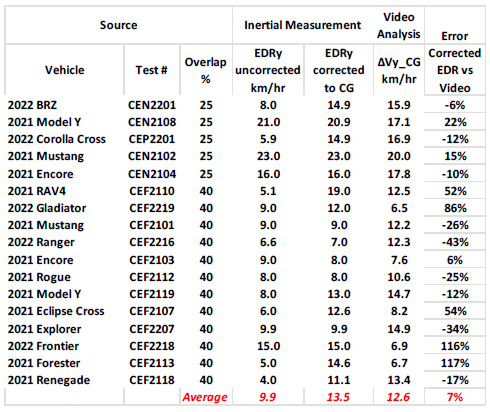
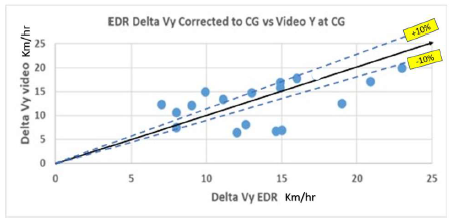
Figure 21 - Delta-Vy corrected to CG vs Video at CG.
The result was a closer correlation but still outside the normal +/-10% bounds validated in the primary axis.
The 25% Overlap tests had no clipping observed. Of the 40% Overlap tests, 14 of the 27 had a data element that said there was no clipping, 11 of 27 gave no indication, and 2 of the 27 (which was 2 of the 3 Hondas) said there was clipping and gave a time. Examining the acceleration traces, no values over 20G were listed in one and none over (approx.) 15g in the other. There were no “flat lines” in the accelerometer trace. The Honda Y-accelerometer must be a lower value than the Honda X-accelerometer and could be in the range of 20G. The two Honda tests that reported clipping reported a small Delta-Vy, as low as 2 km/hr lateral cumulative Delta-Vy, where none would be expected. The author’s assessment is that any Delta-Vy clipping was minor and did not affect the conclusions.
Evert Data Recorder information in ACMs from 15 different brands of vehicles subjected to IIHS frontal offset crash testing were evaluated for agreement with reference instrumentation. EDR Speed data was consistent within -2.2/+1.9 km/hr which is more accurate than the commonly accepted +/-4%. Delta-Vx in 40% overlap tests was consistent within the commonly accepted +/-10%. Delta-Vx in small overlap tests initially had 4 outliers in 15 tests, but when IIHS Delta-Vx was replaced by Delta-Vx from video analysis the EDR was reconciled within the +/-10%.
Delta-Vy in 40% overlap tests in the literature has historically not been consistent with reference instrumentation due to vehicle rotation, EDR location ahead the center of gravity, and reference instrumentation location behind the center of gravity. This research attempted to quantitatively correct for sensor locations. The corrections improved the correlation, but the data scatter was still wider than the generally accepted +/-10%. This is partly because the exact EDR location could not be determined since the vehicles can no longer be measured and the manufacturers do not publish this information. In this test type the Y-axis is a secondary axis with values lower in magnitude so that even small errors result in a larger percentage error.
The authors evaluated whether EDR proximity to the RO point contributed to the poor correlation of Delta-Vy after correction. Video analysis showed the vehicles rotated about a point just off the front corner of the vehicle, which should have been far enough away to minimize any significant effect on the corrections. The tests used to develop and validate the Delta-Vy correction formula were side impacts at the vehicle extremities, a very different crash mode than was being evaluated in these tests. Further research is required to improve the correlation of EDR to reference accelerometers not on the CG location in this crash mode.
Finally, the EDR Delta-Vy had closer correlation to the video analysis taken by monitoring directly at the CG point. Using the translation from the IIHS accelerometers not on the CG to the CG resulted in larger disagreement with the EDR for Delta-Vy.
[1] Chidester, A., Hinch, J., Mercer, T., et al., "Recording Automotive Crash Event Data," presented at the International Symposium on Transportation Recorders, Arlington, VA, May 3-5, 1999.
[2] Lawrence, J., Wilkinson, C., King, D., Heinrichs, B. et al., "The Accuracy and Sensitivity of Event Data Recorders in Low Speed Collisions," SAE Technical Paper 2002-01-0679, 2002, doi:10.4271/2002-01-0679.
[3] Lawrence, J., Wilkinson, C., Heinrichs, B., and Siegmund, G., "The Accuracy of Pre-Crash Speed Captured by Event Data Recorders," SAE Technical Paper 2003-01-0889, 2003, doi:10.4271/2003-01-0889.
[4] Comeau, J., German, A., and Floyd, D., "Comparison of Crash Pulse Data from Motor Vehicle Event Data Recorders and Laboratory Instrumentation," presented at the Canadian Multidisciplinary Road Safety Conference XIV, June 27-30, 2004.
[5] Wilkinson, C., Lawrence, J., Heinrichs, B., and King, D., "The Accuracy and Sensitivity of 2003 and 2004 General Motors Event Data Recorders in Low-Speed Barrier and Vehicle Collisions," SAE Technical Paper 2005-01-1190, 2005, doi:10.4271/2005-01-1190.
[6] Niehoff, P., Gabler H., Brophy J., Chidester C., Hinch J., Ragland C., "Evaluation of Event Data Recorders in Full Systems Crash Tests," National Highway Traffic Safety Administration, Paper Number 05-0271, USA, 2005.
[7] Gabler, C., Thor, C., and Hinch, J. "Preliminary Evaluation of Advanced Air Bag Field Performance Using Event Data Recorders," National Highway Traffic Safety Administration, Report No. DOT HS 811 015, USA, Aug. 2008.
[8] Ruth, R., West, O., Engle, J., and Reust, T., "Accuracy of Powertrain Control Module (PCM) Event Data Recorders," SAE Technical Paper 2008-01-0162, 2008, doi:10.4271/2008- 01-0162.
[9] Ruth, R., and Reust, T., "Accuracy of Selected 2008 Chrysler ACM EDR's During Braking," Collision Magazine 4(1): 32- 39, 2009.
[10] Exponent Failure Analysis Associates, "Testing and Analysis of Toyota Event Data Recorders," https://pressroom.toyota.com/article_download.cfm?article_id=3196, Oct. 2011.
[11] Brown, R., Lewis, L., Hare, B., Jakstis, M. et al., "Confirmation of Toyota EDR Pre-crash Data," SAE Technical Paper 2012-01- 0998, 2012, doi:10.4271/2012-01-0998.
[12] Wilkinson, C., Lawrence, J., Nelson, T., and Bowler, J., "The Accuracy and Sensitivity of 2005 to 2008 Toyota Corolla Event Data Recorders in Low-Speed Collisions," SAE Int. J. Trans. Safety 1(2):420-429, 2013, doi:10.4271/2013-01-1268.
[13] Comeau, J-L., Dalmotas, D.J., and German, A., “Event Data Recorders in Toyota Vehicles”, Proceedings of the 21st Canadian Multidisciplinary Road Safety Conference, Halifax, Nova Scotia, May 8-11, 2011.
[14] Tsoi, A., Hinch, J., Ruth, R., and Gabler, H., "Validation of Event Data Recorders in High Severity Full-Frontal Crash Tests," SAE Int. J. Trans. Safety 1(1):76-99, 2013, doi:10.4271/2013-01-1265
[15] Haight, S., and Haight, R., "Analysis of Event Data Recorder Delta-V Reporting in the IIHS Small Overlap Crash Test," Collision Magazine 8(2): 8-23, 2013
[16] Diacon, Daily and Ruth “Accuracy and Characteristics of 2012 Honda Event Data Recorders from Real-Time Replay of Controller Area Network (CAN) Traffic”, SAE 2013-01-1264
[17] Ruth, R. and Tsoi, A., "Accuracy of Translations Obtained by 2013 GIT Tool on 2010-2012 Kia and Hyundai EDR Speed and Delta-V Data in NCAP Tests," SAE Technical Paper 2014-01- 0502, 2014, doi:10.4271/2014-01-0502.
[18] Bortles et al, “Compendium of Pass Vehicle EDR Literature and Analysis of Validation Studies”, SAE 2016-01-1497
[19] National Archives and Records Administration, "Part 563 - Event Data Recorders," Federal Register 71(166): 51043-51048, Docket No. NHTSA-2006-25666, Aug. 28, 2006
[20] Scurlock, R, Rich, A, Poe, K. “Corrections to Off-axis Measurements from Event Data Recorders” Collision Magazine June 2021
[21] Tsoi et al Validation of Event Data Recorders in Side-Impact Crash Tests, SAE 2014-01-0503
[22] Nathan Rose et al. “Motorcycle accident reconstruction incorporating EDR data” Collision Magazine V13, I2 (2014)
[23] Paolino, S, Zampa, F. Determination of vehicle speed from recorded video using the open-source software Kinovea. J Forensic Sci. 2023; 68: 667–675, doi:10.1111/1556-4029.15191
[24] Spek, A., Otjens, J., Understanding pre-crash speed sampling by the VAG (Volkswagen Automotive Group) Event Data Recorder, Forensic Science International, Volume 351, October 2023 25.
[25] Garrott, W., Monk, M., and Chrstos, J., "Vehicle Inertial Parameters-Measured Values and Approximations," SAE Technical Paper 881767, 1988
[26] MacInnis, D., Cliff, W., and Ising, K., "A Comparison of Moment of Inertia Estimation Techniques for Vehicle Dynamics Simulation," SAE Technical Paper 970951, 1997, https://doi.org/10.4271/970951.
[27] SAE course C1210 materials, “Applying Automotive EDR data to Traffic Crash Reconstruction”, 2023
For more information contact Richard Ruth, [email protected].
The authors wish to thank Raul Arbelaez and Becky Mueller of IIHS for their assistance in identifying relevant tests and providing access to IIHS data, and to M&M Salvage for their assistance in recovering ACM’s from IIHS test vehicles.
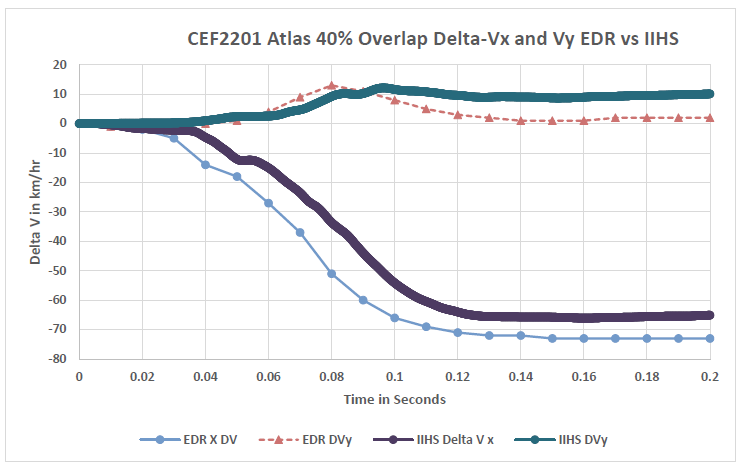
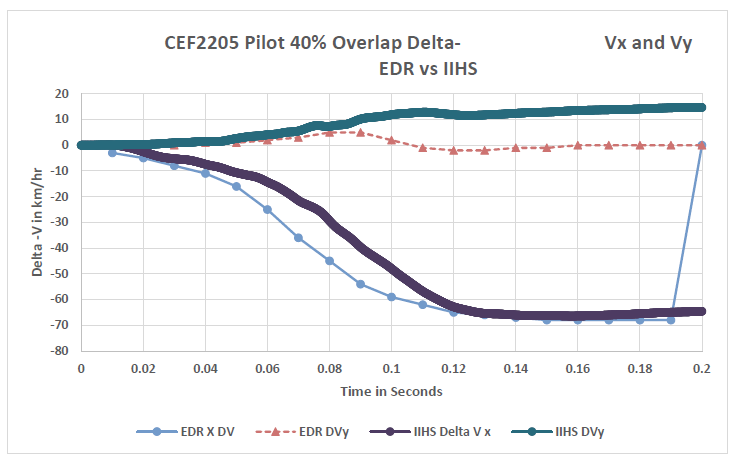
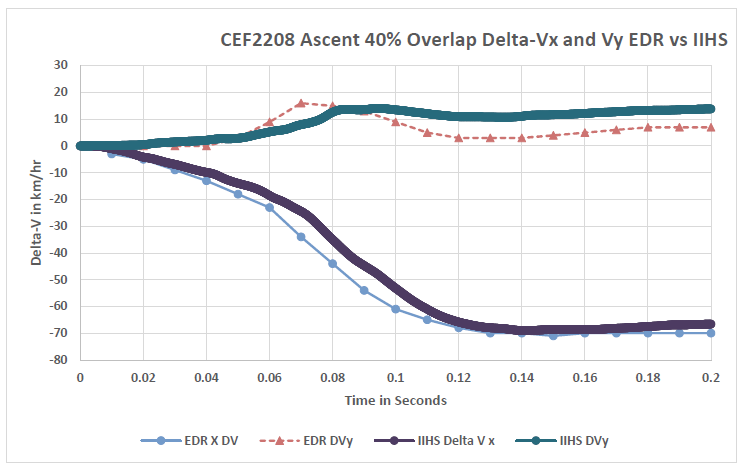
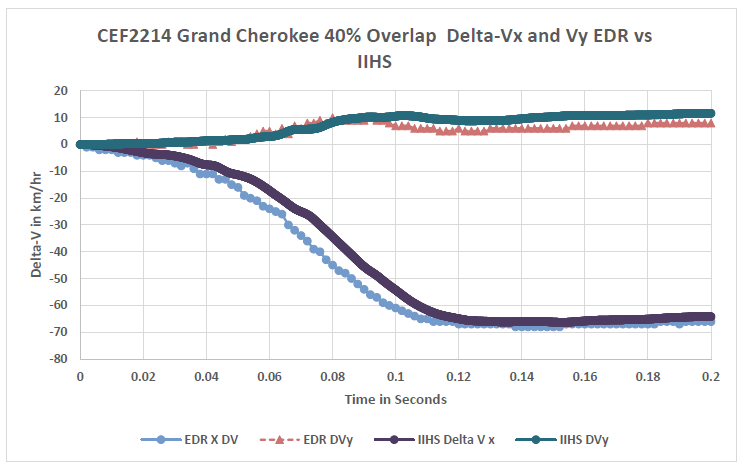
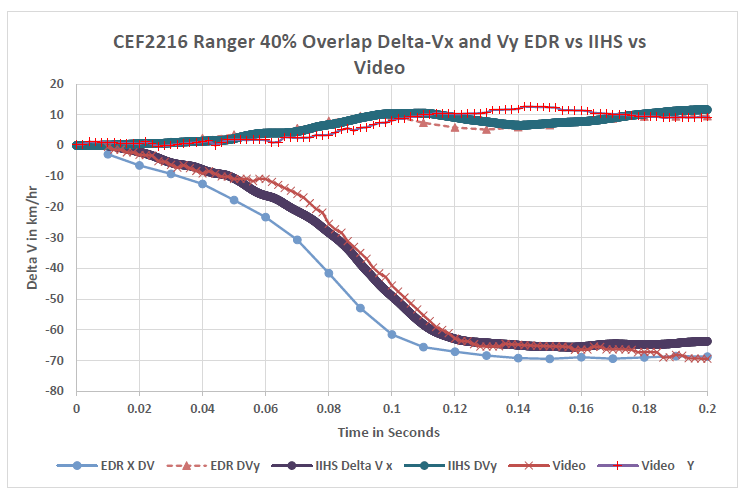
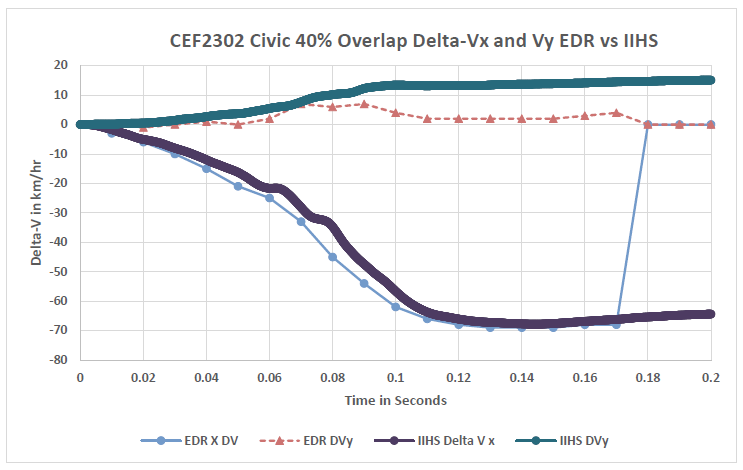
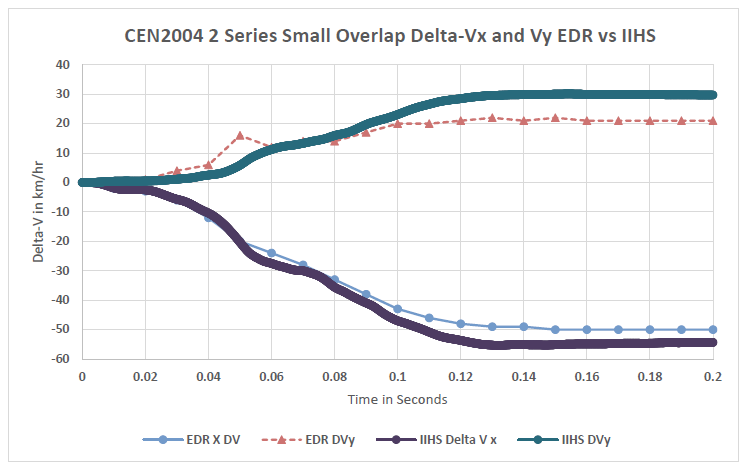
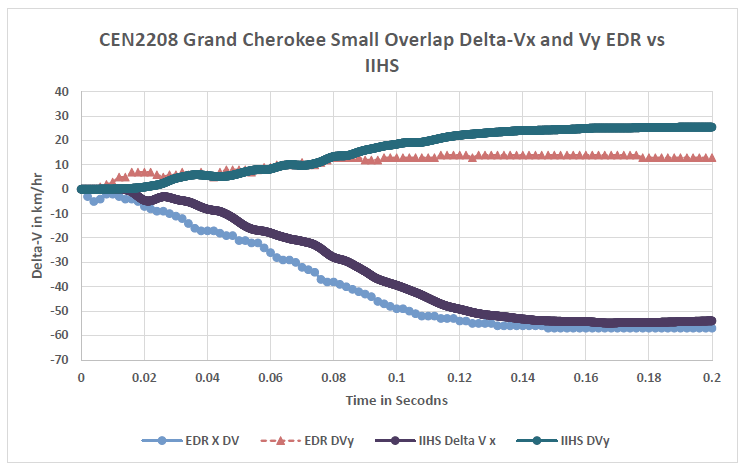
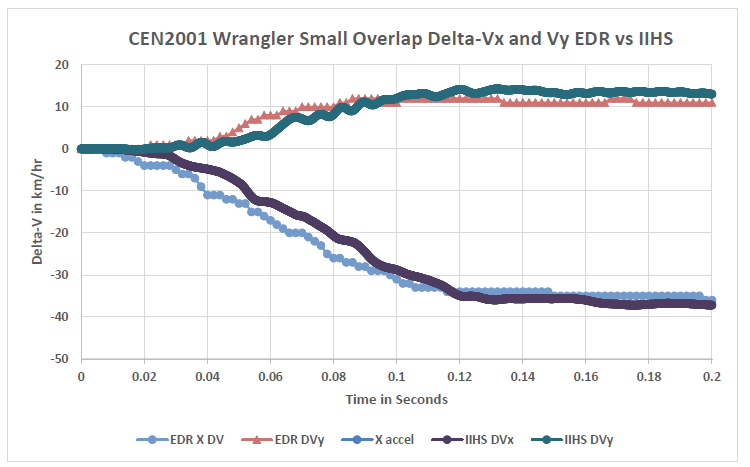
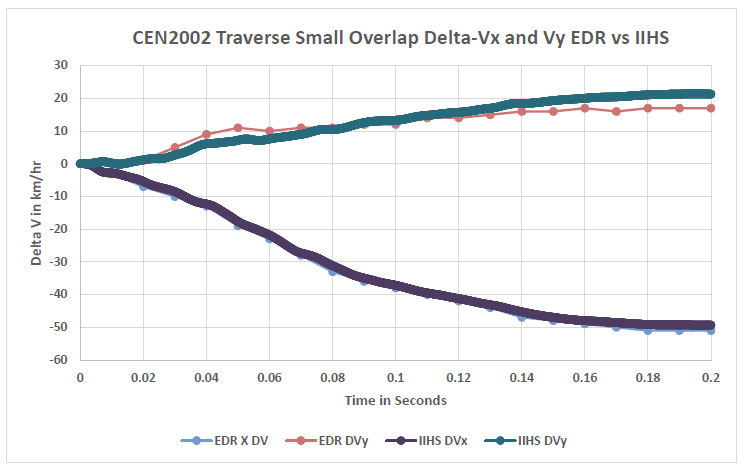
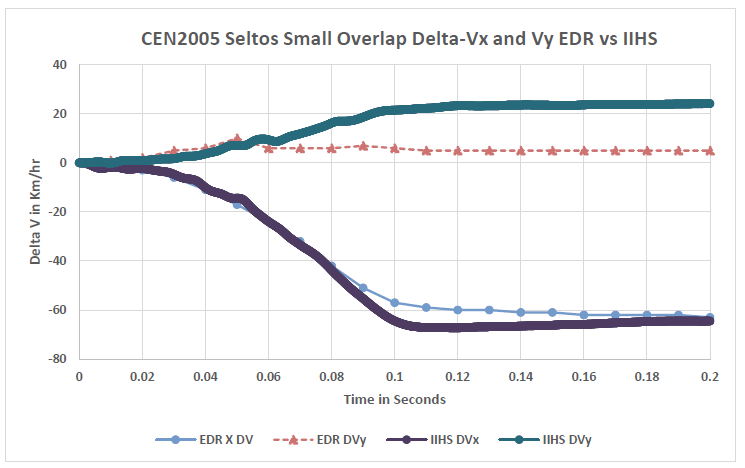
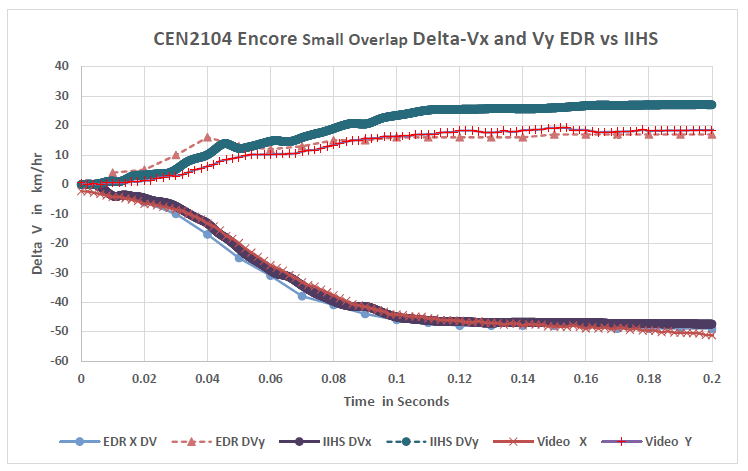
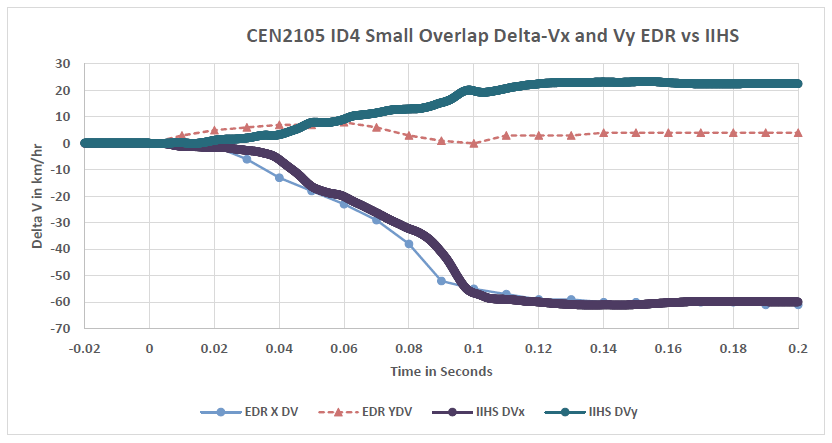
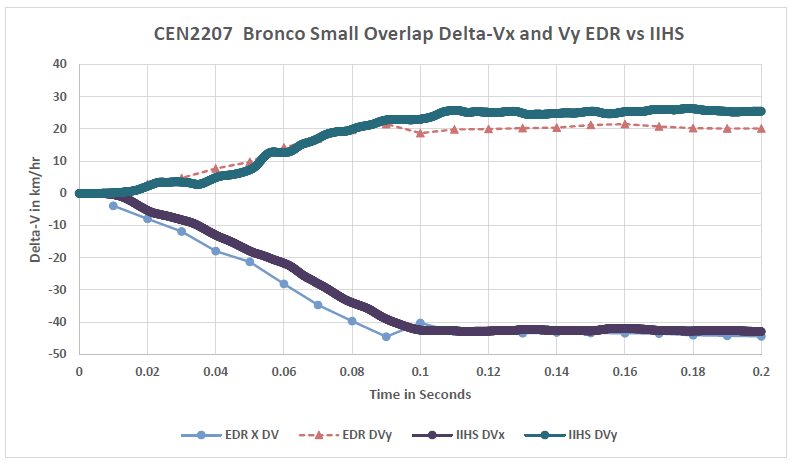
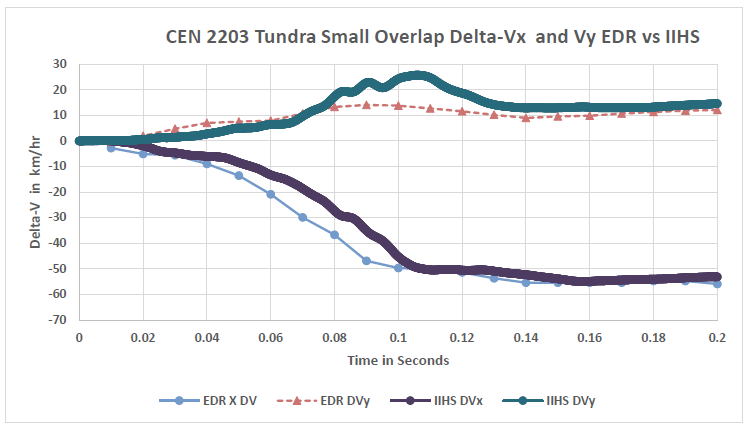
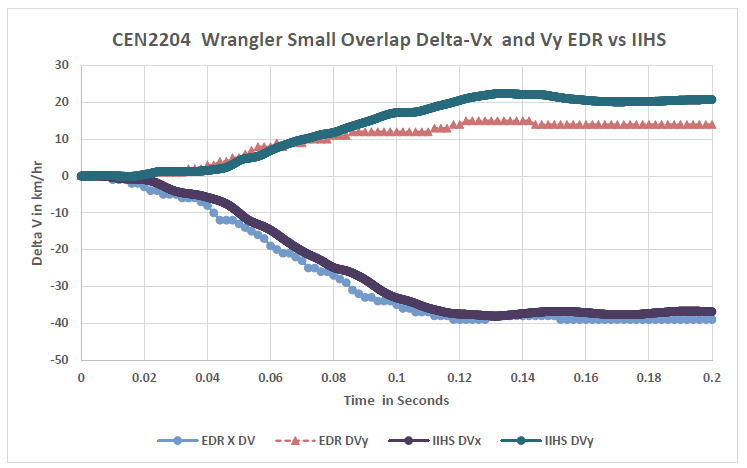
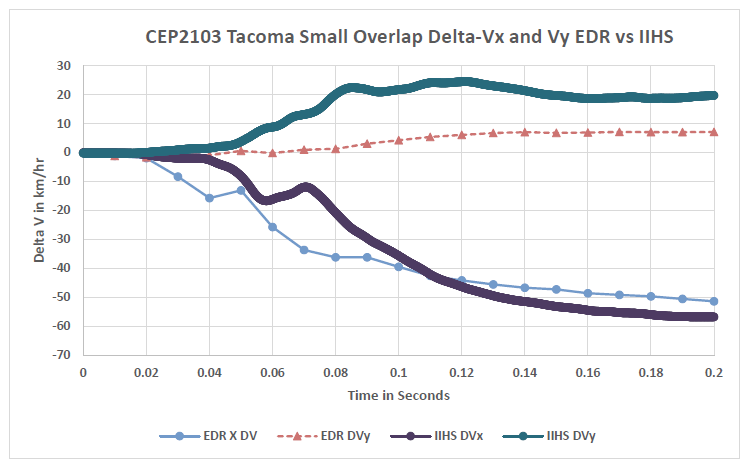
Individual Graphs of delta-V EDR vs IIHS showing both X- and Y-axis are shown on the following pages for each test. Video analysis is also shown for the selected tests where it was completed. EDR wakeup was simply aligned with the IIHS start of crash. There may be a delay from IIHS start of crash to wake up, so the EDR may appear to be leading the IIHS data in time. The first few graphs are those from the small overlap tests where Delta-Vx EDR did not agree with the IIHS data, and video analysis was used as an alternative reference instrumentation. The remainder are in the order of the spreadsheets.
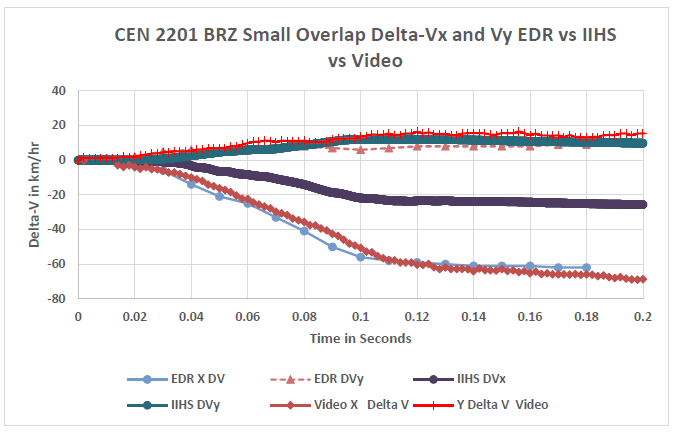
The IIHS X accelerometer Delta-Vx is not supported by the IIHS video analysis. Diadem cell G12 notes the accelerometer block was installed at a 90-degree angle, although the report implies it was corrected, the video does not agree.
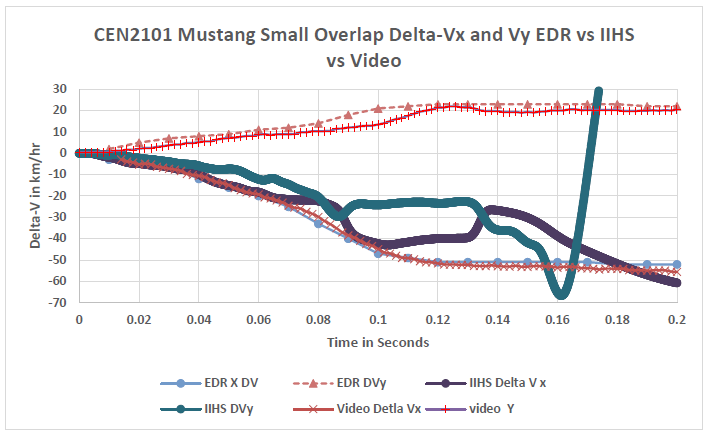
IIHS notes indicate a note that the accelerometer broke loose from its mounting during the test. The Video supports the EDR as correct.
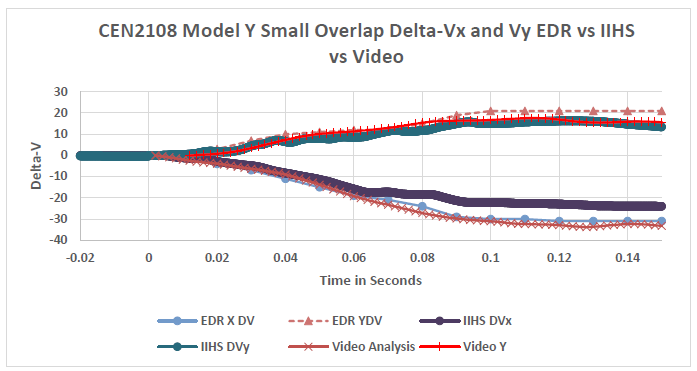
The IIHS video analysis of Delta-Vx is more in agreement with the EDR than the IIHS accelerometer.
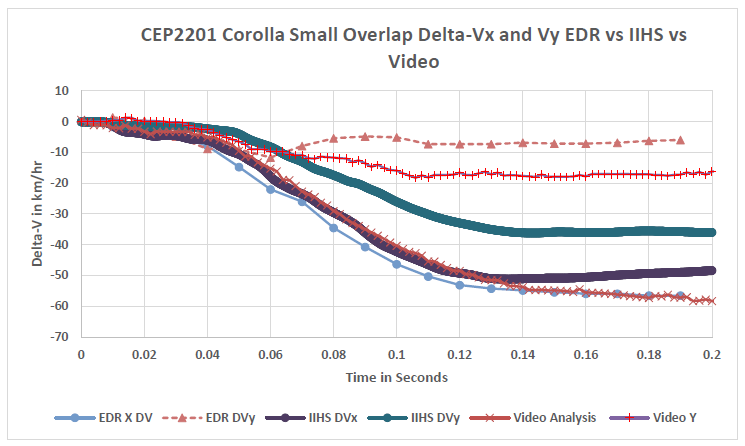
After considering that EDR wakeup time zero is later than the IIHS accelerometer time zero, the traces agree early in the crash, but the Video final Delta-Vx value is more in agreement with the EDR than the IIHS accelerometer data.
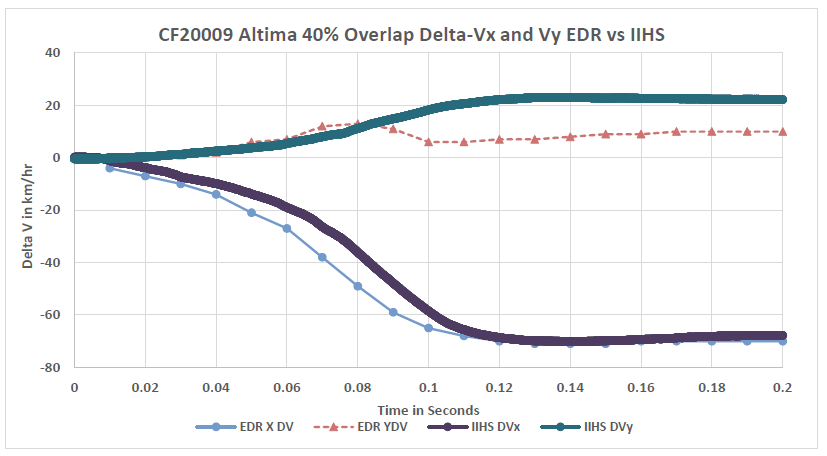
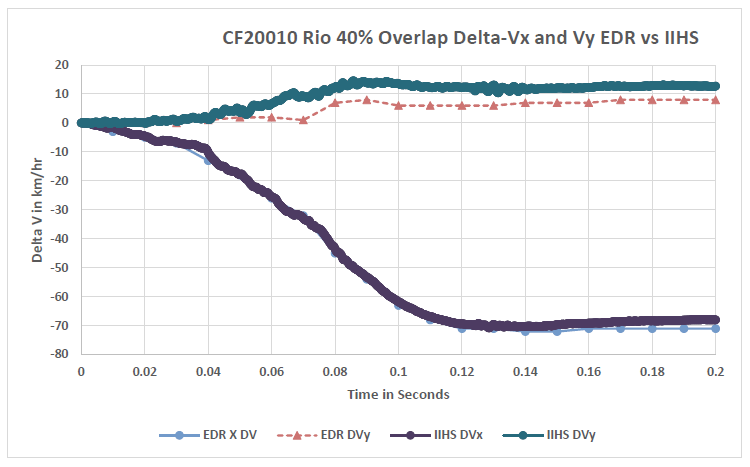
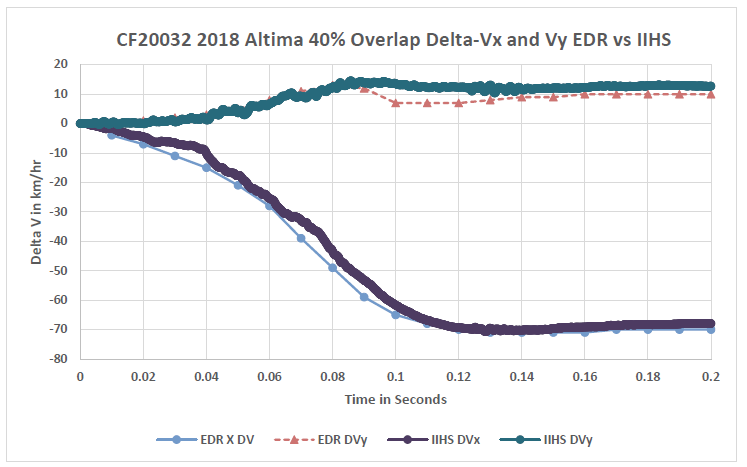
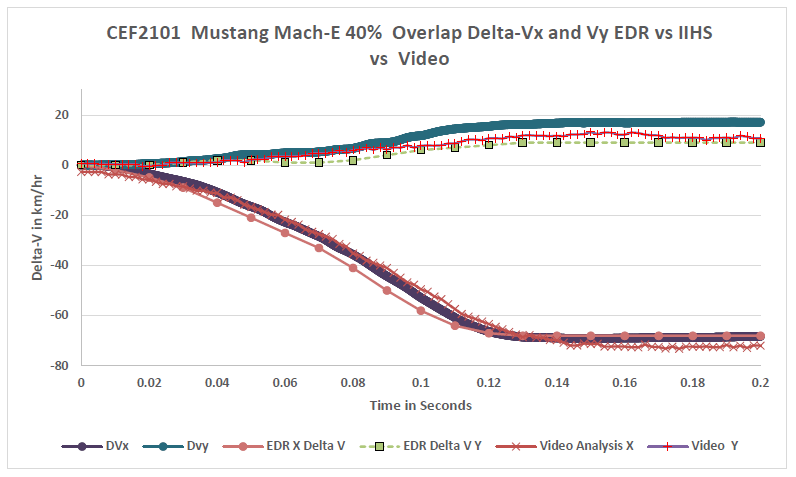
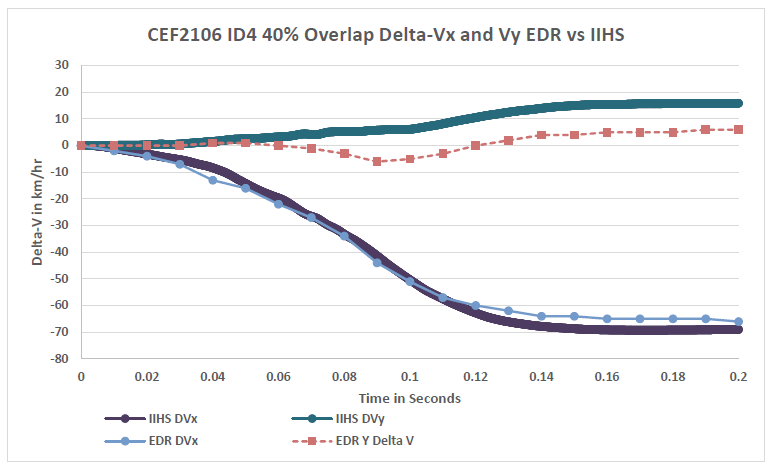
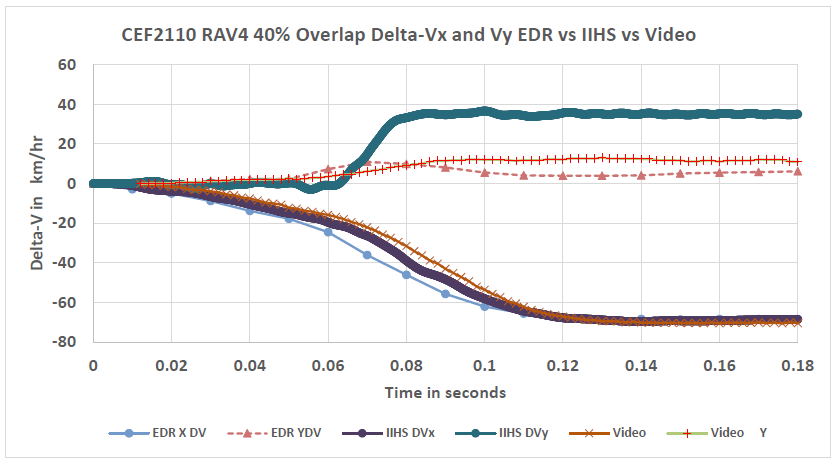
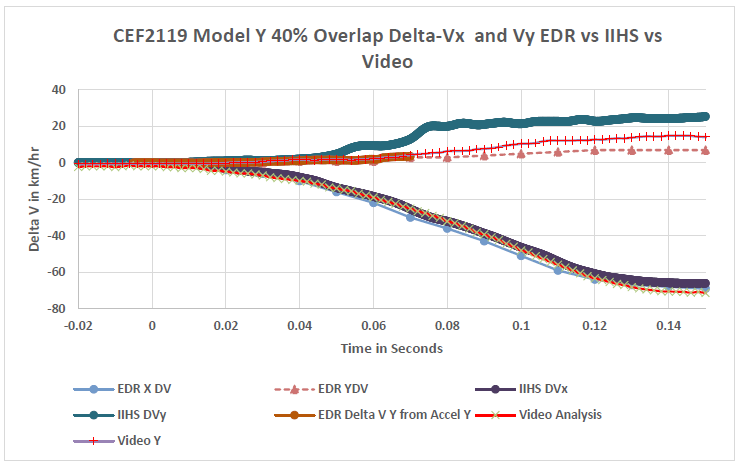
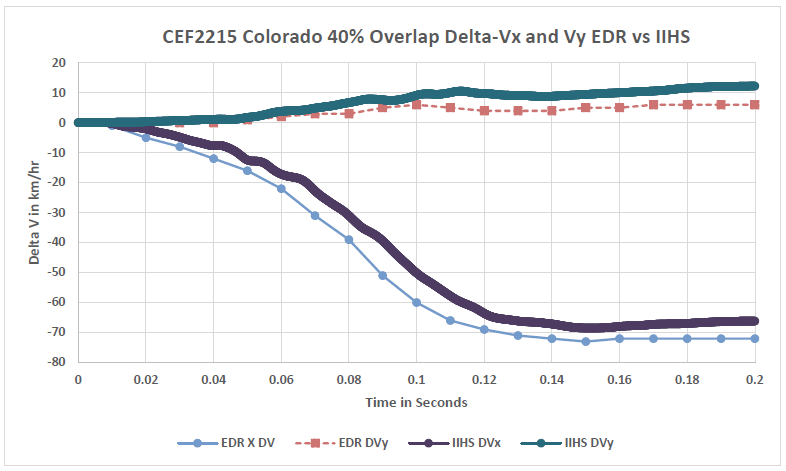
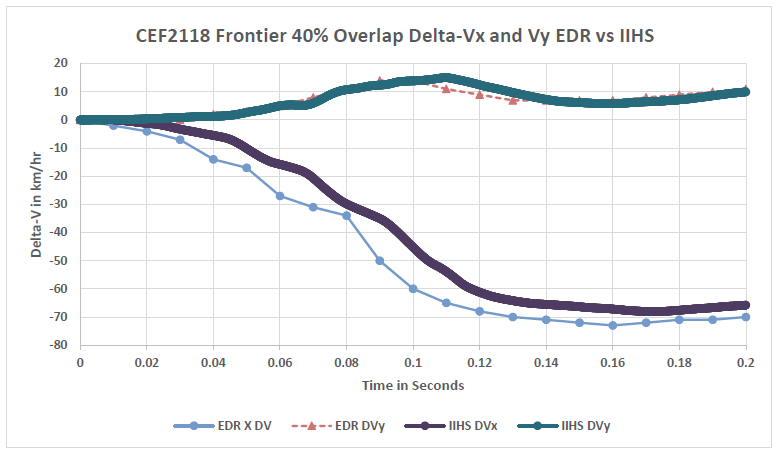
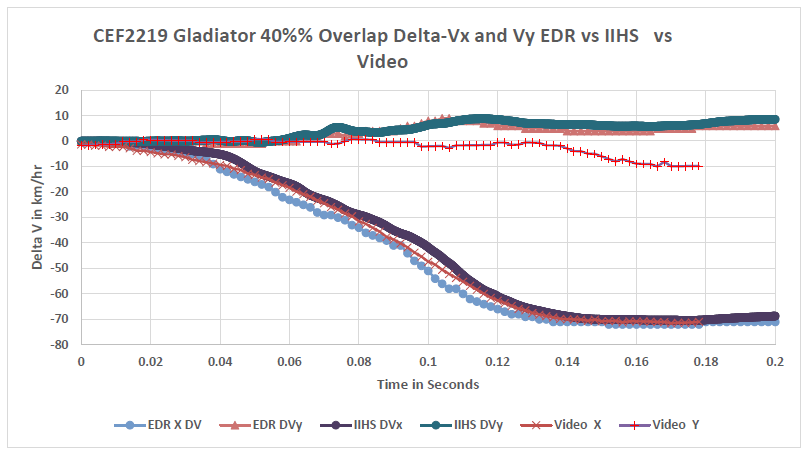
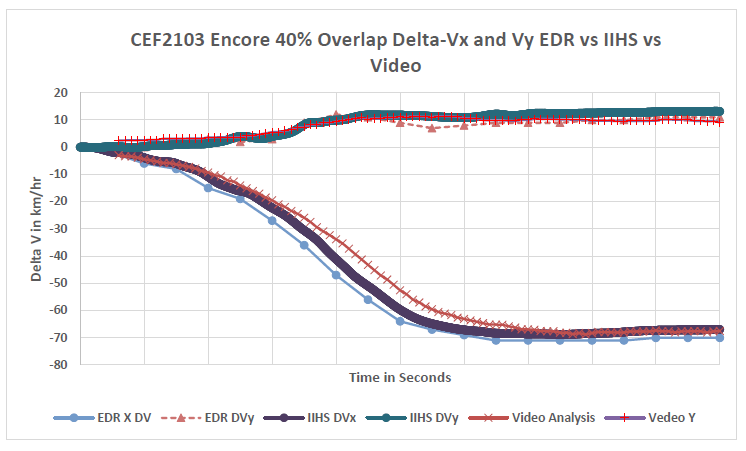
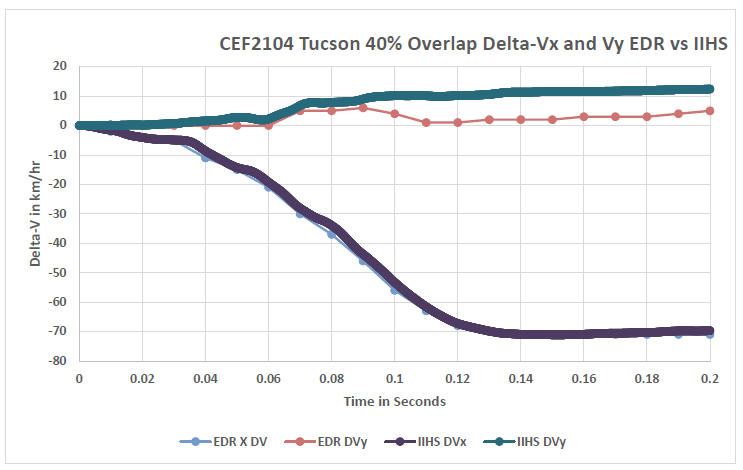
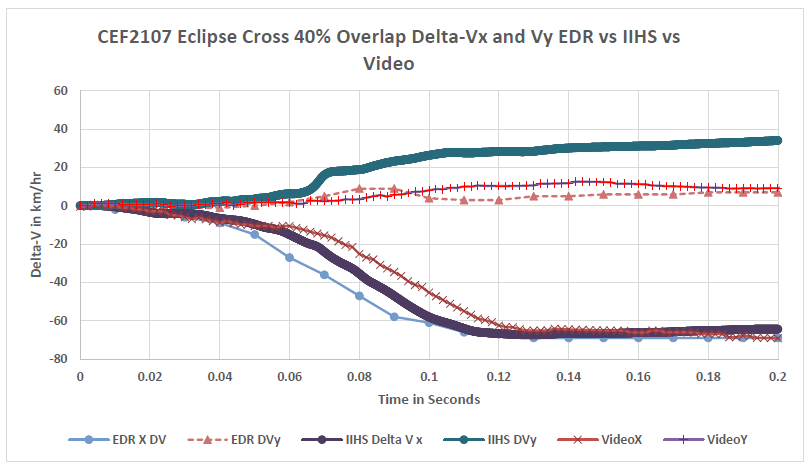
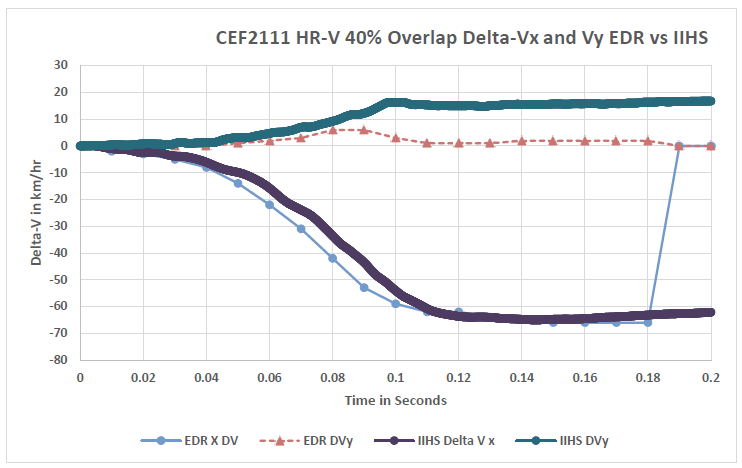
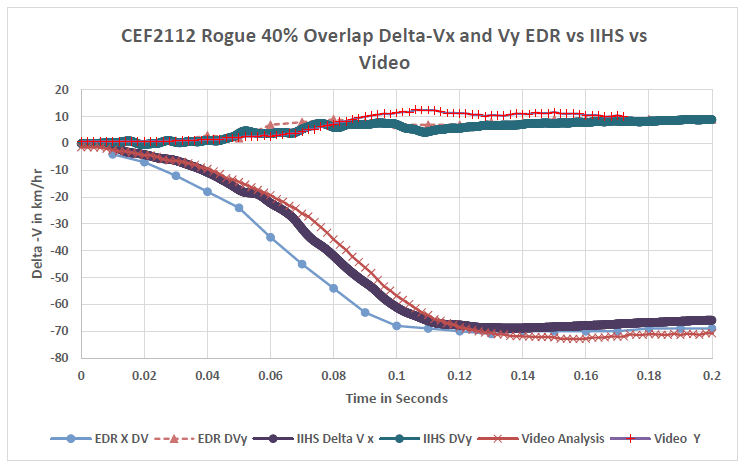
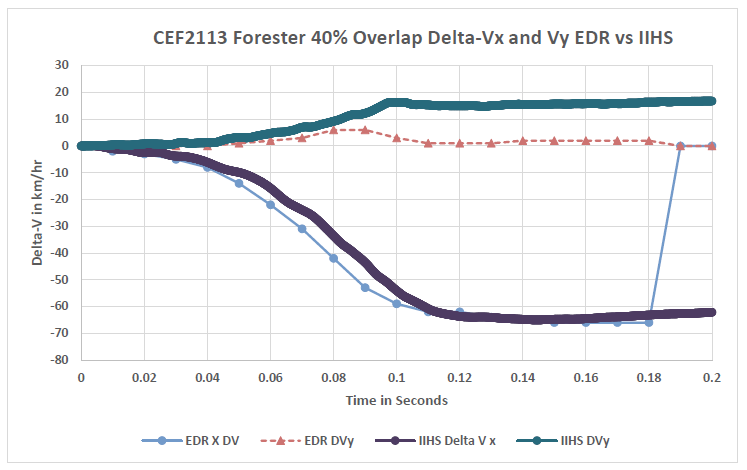
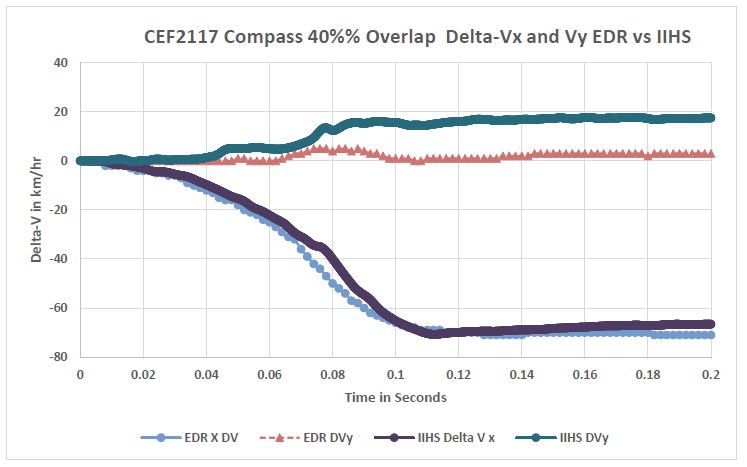
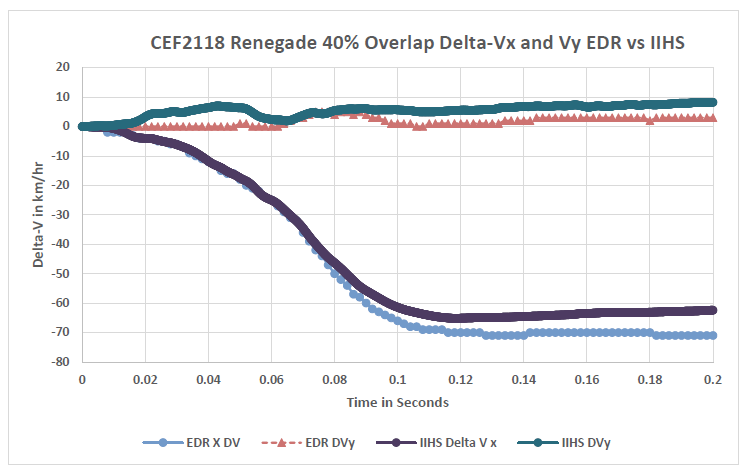
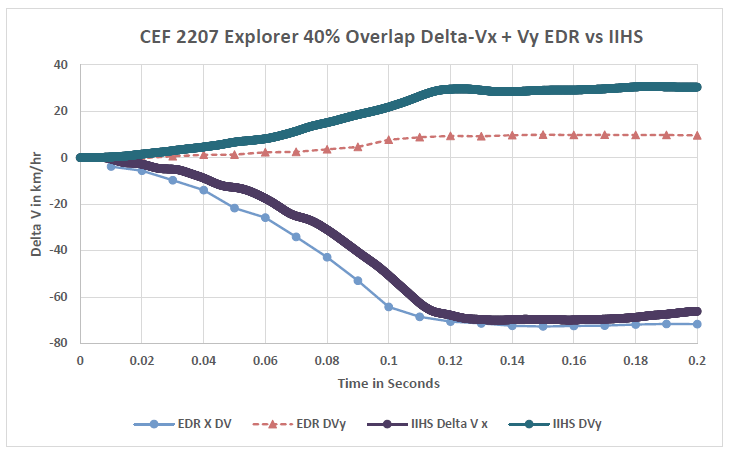
Explorer IIHS instrumentation was in the trunk far behind the CG and partly explains the discrepancy in Delta-Vy.

Crash reconstruction is the application of scientific principles to determine what occurred in a collision or other claim. Accident reconstructionists provide their findings to insurance companies or to lawyers eventually providing expert testimony at trial...
During a crash, the kinetic energy from a moving vehicle is converted into crush damage. When reconstructionists need to assess the severity of a crash, one of the tools at their disposal is the crush...
Automotive safety systems have evolved significantly considering that the seatbelt was not mandatory in new North American vehicles until 1968, 13 years after the seatbelt was first made available as an option. Likewise, airbags began...